
Understand the idea.
Plan a sketch instead of guessing
Build a sketch from justified features in a useful order: domain, intercepts and symmetry, then asymptotes and derivative information. Label exact coordinates, keep holes open, and draw separate branches at every domain break.
A derivative sign table organises the direction of each branch. Combine it with function signs and limits so that the curve reaches the correct ends. A graphing window may hide features, so use technology to check rather than supply the algebraic argument.
Check the final picture
Check the finished curve against every established fact. A branch above the axis must stay above unless an allowed zero is present; a decreasing interval must not contain an invented turn. Use symmetry to cross-check matching features.
Do not force a graph to have every familiar feature. Some have no intercepts or no vertical asymptotes. A horizontal asymptote concerns distant behaviour and can differ completely from a tangent at a finite point.
See the method in action.
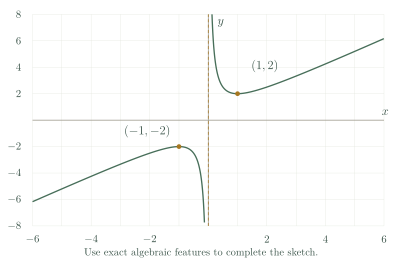
A complete reciprocal-plus-line sketch
Sketch using its domain, extrema and asymptotes.
Worked solution
- 1
Find the domain, symmetry and intercepts.
The graph is odd, has no real horizontal intercept, and has no vertical intercept because zero is excluded.
- 2
Establish the asymptotes.
The vertical asymptote is and the oblique asymptote is .
- 3
Locate the stationary points.
Both derivative zeros are allowed inputs.
- 4
Classify the extrema.
The negative branch has a local maximum at ; the positive branch has a local minimum at .
- 5
Join each branch using its sign and limits.
The negative branch stays below the axis and the positive branch stays above it, with the labelled turns and asymptotes fixing their shapes.
Two odd-symmetric branches; x=0 is vertical, y=x is oblique; extrema and ; no intercepts.
A bounded positive curve
For , justify the complete graph from symmetry, derivative and limits.
Worked solution
- 1
Establish domain, symmetry and positivity.
The curve is defined everywhere, is even and never meets the horizontal axis.
- 2
Find the derivative and stationary input.
The denominator is positive, so only the numerator determines derivative zeros and signs.
- 3
Classify the stationary point.
The function increases to a global maximum and then decreases.
- 4
Determine end behaviour and bounds.
The horizontal asymptote is , approached from above; the denominator never vanishes, so there is no vertical asymptote.
- 5
Complete the symmetric sketch.
Draw two matching sides about the vertical axis, meeting smoothly at and approaching zero without reaching it.
An even positive curve, maximum , approaching y=0 at both ends with no vertical asymptote.
Try it yourself.
Check your understanding
Does a horizontal asymptote describe a local tangent?
Show answer & reasoning
No.
A horizontal asymptote describes a limiting value as the input tends to an infinite end. A local tangent instead describes the slope at a particular finite graph point, so the two concepts are different.
Keep practising
6 worksheet questions · 23 marks
Read the questions online
- Sketch using its domain, extrema and asymptotes.5 marks
- Give a complete sketch description of .4 marks
- A student draws one continuous curve through for . Explain and correct the sketch.3 marks
- For , justify the complete graph from symmetry, derivative and limits.4 marks
- Two formulas simplify to the same expression. Explain why their graphs might still differ.3 marks
- Find the tangent to at and explain why it does not determine the whole graph.4 marks
Read the worked solutions
Equivalent correct methods earn the corresponding marks. Include units where asked.
- Sketch using its domain, extrema and asymptotes.5 marks
The equation is undefined at 0.
The difference from is , tending to zero at either end.
Derivative signs determine each branch shape.
Two odd-symmetric branches; is vertical, is oblique; extrema and ; no intercepts. - Give a complete sketch description of .4 marks
Use the two linear branches and place the exact intercepts.
The function is continuous but not differentiable at .
V shape with vertex , roots and 5, y-intercept ; slopes then 1; range . - A student draws one continuous curve through for . Explain and correct the sketch.3 marks
The original denominator is zero at 1.
The numerator is nonzero there, giving a pole rather than a hole.
The graph must be broken into branches separated by the vertical asymptote . - For , justify the complete graph from symmetry, derivative and limits.4 marks
.
The derivative is positive for negative and negative for positive .
The denominator never vanishes.
An even positive curve, maximum , approaching at both ends with no vertical asymptote. - Two formulas simplify to the same expression. Explain why their graphs might still differ.3 marks
Compare with .
Only the second excludes .
Their original domains may differ, producing a hole in one graph. - Find the tangent to at and explain why it does not determine the whole graph.4 marks
and .
A tangent is local information; extrema and end behaviour need separate analysis.
.
Curriculum reference & lesson scope
SACE Board of South Australia
Stage 2 Specialist functions and sketching graphs. Calculus-based analysis assumes concurrent Methods differentiation; real-polynomial division detail is taught in the separate Real Polynomials chapter.
Official curriculum source ↗