
Understand the idea.
Read the scale before the shape
Read axis labels, units and the baseline before judging the shape of a graph. When a bar axis begins above zero, the visible heights represent amounts above that baseline, so their ratio does not equal the ratio of the actual values.
Also check equal numerical intervals, missing dates and sample sizes. Time positions should match elapsed time. Enlarging both a picture’s height and width exaggerates its area, and a steep-looking line cannot be interpreted without reading both axis scales.
Use the right denominator
When groups have different numbers of opportunities, compare rates as well as counts. A complaint count depends on how many orders were handled: divide complaints by orders to obtain the complaint proportion, then convert to a percentage if useful.
Keep causal claims separate from descriptive patterns. Two quantities changing together may reflect other influences. A sound conclusion identifies the measured difference and its denominator, rather than relying on a dramatic picture or assuming that association proves causation.
| Business | Complaints | Orders | Rate |
|---|---|---|---|
| A | 12 | 300 | 4% |
| B | 10 | 200 | 5% |
See the method in action.
An exaggerated sales claim
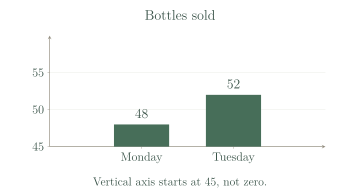
The graph shows 48 bottles on Monday and 52 on Tuesday. A caption says sales more than doubled.
Worked solution
- 1
Read the actual sales values.
The bars are labelled with bottle counts; their heights above the truncated baseline are not the actual totals.
- 2
Calculate the increase.
Change is the later count minus the original count.
- 3
Calculate the proportional increase.
Percentage increase uses the original Monday count as the denominator.
- 4
Assess the caption.
Tuesday sales are about times Monday sales, so they did not more than double; the axis starting at exaggerates the visible height ratio.
The claim is false: 4 more bottles, about 8.3%.
Counts versus rates
A has 12 complaints from 300 orders; B has 10 from 200. Which complaint rate is lower?
Worked solution
- 1
Calculate A’s complaint rate.
Relate A’s complaints to A’s total orders.
- 2
Calculate B’s complaint rate.
Use B’s own order total as the denominator.
- 3
Compare the rates.
A has the lower complaint rate, despite having two more complaints in raw counts.
A, with 4% rather than 5%.
Try it yourself.
Check your understanding
A score rises from 50 to 55. Is that a 5% increase?
Show answer & reasoning
No; it is 10%.
The score increases by . Relative to the original , this is , rather than .
Keep practising
6 worksheet questions · 13 marks
Read the questions online
- Attendance rises from 120 to 132. Find the numerical and percentage increases.3 marks
- A poll reports 80% agreement without giving a sample size. Name two missing details that matter.2 marks
- A has 8 late appointments out of 100; B has 12 out of 200. Compare late rates.2 marks
- A graph places years 2010, 2011 and 2020 equally far apart. Explain the issue.2 marks
- An icon doubles in both height and width. By what factor does its area change, and why can this mislead?2 marks
- Ice-cream sales and swimming incidents both rise in hot weather. Does this prove ice cream causes incidents?2 marks
Read the worked solutions
Equivalent correct methods earn the corresponding marks. Include units where asked.
- Attendance rises from 120 to 132. Find the numerical and percentage increases.3 marks
Increase .
.
12 people; 10%. - A poll reports 80% agreement without giving a sample size. Name two missing details that matter.2 marks
80% of 5 has different stability from 80% of 5,000.
Voluntary or biased selection may distort the proportion.
Sample size and selection method. - A has 8 late appointments out of 100; B has 12 out of 200. Compare late rates.2 marks
.
.
A: 8%; B: 6%; B is lower. - A graph places years 2010, 2011 and 2020 equally far apart. Explain the issue.2 marks
Equal horizontal distances should mean equal times when showing change.
Use proportional spacing or a different clearly explained display.
A nine-year interval is drawn the same width as a one-year interval. - An icon doubles in both height and width. By what factor does its area change, and why can this mislead?2 marks
Area factor .
Viewers may infer four times the quantity when only doubling was intended.
Area becomes four times as large. - Ice-cream sales and swimming incidents both rise in hot weather. Does this prove ice cream causes incidents?2 marks
The evidence shows an association.
Other explanations and appropriate study evidence are needed for causation.
No; hot weather may influence both.
Curriculum reference & lesson scope
Australian Curriculum v9 / SA Curriculum Mathematics
Year 9 sampling, comparative distributions, centre/spread/outliers, displays, critique and statistical investigations.
Official curriculum source ↗