
Understand the idea.
One input, one output
A table of values records the output for each chosen input. Substitute the entire signed number in brackets before evaluating powers: when , . Then complete the remaining operations in the rule.
Each table row becomes an ordered pair . Plot input horizontally and output vertically. The table samples the relationship; for a quadratic with unrestricted real inputs, there are points between the listed ones as well.
See the shape, not a zigzag
A quadratic graph is a smooth parabola. Include inputs on both sides of its turning point to see the bend. Joining a few points with straight segments produces a misleading zigzag instead of the actual curve.
Label axes and choose scales that show the intercepts and turning point clearly. Symmetric outputs help check the table. If a point looks inconsistent, recalculate it before changing the graph to fit an error.
See the method in action.
Worked example
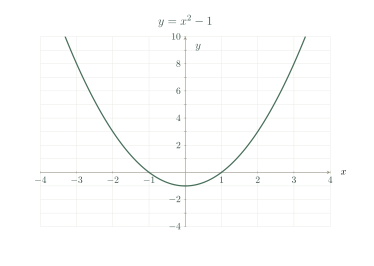
Complete a table for at and describe the graph.
Worked solution
- 1
Square every input.
The negative inputs are squared as whole numbers.
- 2
Subtract one from each square.
The rule applies the same final subtraction to every input.
- 3
Plot the ordered pairs.
Each input pairs with its corresponding output.
- 4
Describe the complete curve.
The graph is a smooth upward-opening parabola with minimum (0,-1), consistent with its symmetric table.
; a smooth upward parabola.
Worked example
Find the missing output for when .
Worked solution
- 1
Replace every x with the signed input.
Brackets preserve the negative sign in both occurrences of x.
- 2
Evaluate the power and product.
Squaring a negative gives a positive, and subtracting a negative adds.
- 3
Write the point in coordinate order.
The input is the first coordinate and the calculated output is the second.
Try it yourself.
Check your understanding
For , find when .
Show answer & reasoning
Substitute using brackets: . The point on the curve is .
Keep practising
6 worksheet questions · 16 marks
Read the questions online
- For , find at .2 marks
- For , find when .2 marks
- Complete the outputs for at .3 marks
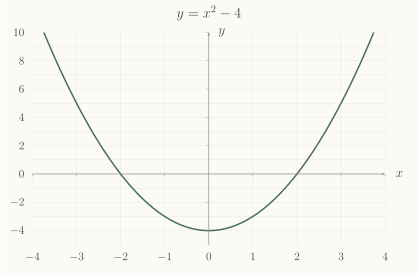
- Use the supplied graph of to read its two points on the -axis.2 marks
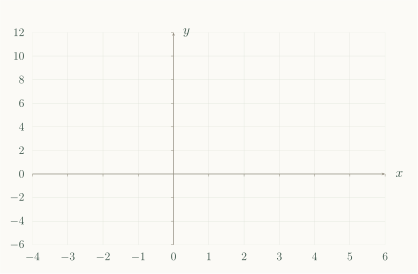
- Sketch using at least five points. State the lowest point.4 marks
- Why is joining only and with a straight line not a sketch of ?3 marks
Read the worked solutions
Equivalent correct methods earn the corresponding marks. Include units where asked.
- For , find at .2 marks
Square the inputs to get , then add .
- For , find when .2 marks
.
- Complete the outputs for at .3 marks
Square each input, then subtract .
- Use the supplied graph of to read its two points on the -axis.2 marks
On the -axis, ; the curve crosses at .
and - Sketch using at least five points. State the lowest point.4 marks
A useful table is .
Join with a smooth upward curve.
Lowest point .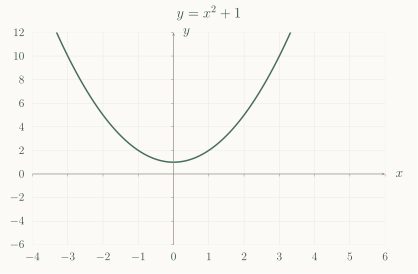
- Why is joining only and with a straight line not a sketch of ?3 marks
At the rule gives , while the straight join gives .
More points are needed to show the turn.
It misses the curved shape and the point .
Curriculum reference & lesson scope
Australian Curriculum v9 / SA Curriculum Mathematics
AC9M9A02, AC9M9A04–A06: monic quadratic expressions, integer-root equations, graphs and models.
Official curriculum source ↗