
Understand the idea.
Keep every observation
A stem-and-leaf display keeps every observation while organising place value. Read the key first: could mean or depending on the stated units. Sort the leaves and retain every repeat.
In a dot plot, each dot represents one observation; repeated values stack above the same numerical position. A frequency table counts occurrences instead. Numerical axis positions must be evenly scaled so gaps and clusters reflect the data rather than the drawing.
| Stem | Leaves |
|---|---|
| 1 | 2 4 4 7 |
| 2 | 0 1 4 4 |
Make comparisons fair
For two groups, use common numerical scales or shared stems in a back-to-back display. Label the groups, key and units. Otherwise stretching one display can make it appear more variable even when the underlying values have not changed.
Compare centre, spread, clusters and gaps, keeping sample sizes in mind. More dots may simply mean more observations, so raw counts are not proportions when group sizes differ. Do not connect unordered observations as if they describe change through time.
See the method in action.
Read the stem-and-leaf plot
Find the sample size, median and range.
| Stem | Leaves |
|---|---|
| 1 | 2 4 4 7 |
| 2 | 0 1 4 4 |
Worked solution
- 1
Decode and retain all leaves.
The key gives centimetres, and repeated leaves are separate measurements.
- 2
Count the observations.
There are four leaves on each of the two stems.
- 3
Average the middle pair.
An even sample of eight has its centre between the fourth and fifth ordered values.
- 4
Calculate the range.
The greatest and least observations determine the full span.
8 observations; median 18.5 cm; range 12 cm.
Two modes
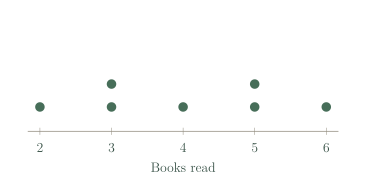
For the plotted books-read data, find median and modes.
Worked solution
- 1
Read the dots in numerical order.
Each dot is one books-read observation, including the stacked repeats.
- 2
Locate the middle position.
An odd sample has one middle observation, here in the fourth position.
- 3
Read the median.
The fourth ordered observation is books.
- 4
Compare frequencies to find all modes.
Both and occur twice, more than any other value, so both are modes.
Median 4; modes 3 and 5.
Try it yourself.
Check your understanding
Stem 3 has leaves 1, 1, 5 and key 3 | 1 = 31. How many values?
Show answer & reasoning
Three: 31, 31 and 35.
There are three leaves, so there are three observations: , and . The repeated leaf represents a second observation of .
Keep practising
6 worksheet questions · 14 marks
Read the questions online
- Construct an ordered stem-and-leaf plot for 21, 15, 19, 12, 21, 25. Include a key.3 marks
- Use the supplied plot. How many values equal 24, and how many values are there altogether?2 marks
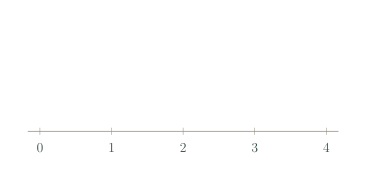
Key: 1 | 4 means 14 cm. Each leaf is one measurement. Stem Leaves 1 2 4 4 7 2 0 1 4 4 - Draw a dot plot for 0, 1, 1, 2, 2, 2, 4 and state the mode.3 marks
- Values 1, 2, 3 have frequencies 4, 2, 3. Find the sample size.2 marks
- Why should two dot plots being compared use the same number scale?2 marks
- Samples have 10 and 30 observations. Does the taller frequency bar necessarily mean a larger proportion?2 marks
Read the worked solutions
Equivalent correct methods earn the corresponding marks. Include units where asked.
- Construct an ordered stem-and-leaf plot for 21, 15, 19, 12, 21, 25. Include a key.3 marks
Order: 12, 15, 19, 21, 21, 25.
Use tens as stems and retain both 21 s.
Stem 1: 2 5 9. Stem 2: 1 1 5. Key .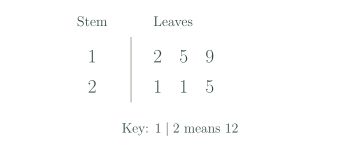
- Use the supplied plot. How many values equal 24, and how many values are there altogether?2 marks
Key: 1 | 4 means 14 cm. Each leaf is one measurement. Stem Leaves 1 2 4 4 7 2 0 1 4 4 Stem 2 contains two leaves of 4.
Count all eight leaves.
Two equal 24; eight altogether. - Draw a dot plot for 0, 1, 1, 2, 2, 2, 4 and state the mode.3 marks
Use equal numerical intervals.
Place one dot per observation; the tallest stack is at 2.
Stack counts are 1, 2, 3, 0, 1 at 0–4. Mode 2.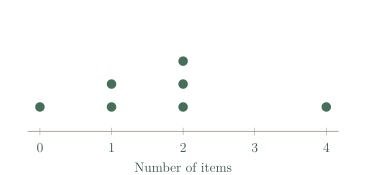
- Values 1, 2, 3 have frequencies 4, 2, 3. Find the sample size.2 marks
Add frequencies, not the values.
.
9. - Why should two dot plots being compared use the same number scale?2 marks
A stretched axis changes the apparent spread.
A common scale makes comparison meaningful.
Equal distances should represent equal numerical differences. - Samples have 10 and 30 observations. Does the taller frequency bar necessarily mean a larger proportion?2 marks
4 out of 10 is 40%, but 9 out of 30 is 30%.
Compare relative frequencies when sizes differ.
No.
Curriculum reference & lesson scope
Australian Curriculum v9 / SA Curriculum Mathematics
Year 9 sampling, comparative distributions, centre/spread/outliers, displays, critique and statistical investigations.
Official curriculum source ↗