
Understand the idea.
Start with the question
Choose a display that serves the question and data type. A bar chart compares counts or proportions in distinct categories. For a small numerical sample, dot plots and stem-and-leaf displays preserve individual values and repeats, making centre and spread visible.
Grouping a larger numerical sample can clarify its overall shape but hides exact values inside each interval. For change through time, place times in chronological order with proportional spacing. Joining observations can highlight a trend without establishing what happened between recorded times.
Design for comparison
For comparisons, keep numerical scales consistent, label the groups and show units or a key. If sample sizes differ, relative frequencies may answer the question more fairly than raw counts. Equal-looking bars from unequal samples need careful interpretation.
More than one display may be suitable. Justify the choice using the information the reader needs: a table supports exact lookup, while a graph reveals patterns. Use sensible intervals and remove decoration that obscures the data.
See the method in action.
Category data
Twenty students choose their favourite fruit. Which display suits the responses?
Worked solution
- 1
Classify the variable.
Favourite fruit is categorical: fruit names are groups, rather than numerical measurements.
- 2
Count responses in a frequency table.
Each student contributes one choice, so the category frequencies should total twenty.
- 3
Choose and label a bar chart.
Use separate equal-width bars for the fruit categories, with fruit on the horizontal axis and student count on a clearly scaled vertical axis starting at zero.
- 4
Explain why the display fits.
The table gives exact counts and the bar chart makes the relative popularity of the categories easy to compare.
A frequency table and bar chart.
Two small numerical samples
You have jump distances for 12 students in each of two classes. You want to compare distributions.
Worked solution
- 1
Identify the data and purpose.
Jump distance is numerical, and the purpose is to compare two small distributions rather than only their best performances.
- 2
Choose a display retaining all observations.
Use two dot plots sharing one distance scale, or a back-to-back stem-and-leaf plot with shared stems.
- 3
Make the comparison readable.
Label the classes, distance units and scale; both groups contain twelve observations, so their raw frequencies have the same sample-size basis.
- 4
Describe the evidence to compare.
Compare centre, spread, clusters and overlap. Preserving all distances avoids making the largest jump stand in for the whole class.
Common-scale dot plots or a back-to-back stem-and-leaf plot.
Try it yourself.
Check your understanding
What belongs on the horizontal axis for daily rainfall across a month?
Show answer & reasoning
Date or day in order, with equal spacing for equal times.
Use the date or day in chronological order on the horizontal axis. Equal elapsed times should have equal spacing so the rainfall pattern is not distorted by arbitrary positioning.
Keep practising
6 worksheet questions · 12 marks
Read the questions online
- Choose a display for numbers of students travelling by bus, car, bicycle or walking. Explain.2 marks
- Choose a display for 14 hand-span measurements while retaining exact individual values.2 marks
- Why might relative-frequency bars help compare samples of 20 and 100?2 marks
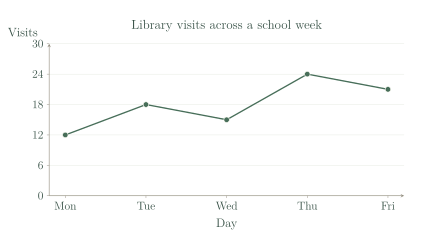
- Use the graph. Which day has the most visits, and how much do visits fall the next day?2 marks
- A display groups ages into ten-year intervals. What detail is lost?2 marks
- A report needs exact enrolment counts. Should it provide only a graph? Explain.2 marks
Read the worked solutions
Equivalent correct methods earn the corresponding marks. Include units where asked.
- Choose a display for numbers of students travelling by bus, car, bicycle or walking. Explain.2 marks
Travel methods are categories.
Count responses and use separate bars with a labelled frequency axis.
A bar chart. - Choose a display for 14 hand-span measurements while retaining exact individual values.2 marks
The sample is small and numerical.
These displays retain repeated values and individual observations.
A dot plot or stem-and-leaf plot. - Why might relative-frequency bars help compare samples of 20 and 100?2 marks
Divide counts by the sample total.
Raw counts may mainly show the sample-size difference.
They compare proportions on a common basis. - Use the graph. Which day has the most visits, and how much do visits fall the next day?2 marks
Thursday has 24 visits; Friday has 21.
.
Thursday; a fall of 3 visits. - A display groups ages into ten-year intervals. What detail is lost?2 marks
Different ages share the same group.
Grouping reveals broad shape but hides fine detail.
Exact ages and variation within each interval. - A report needs exact enrolment counts. Should it provide only a graph? Explain.2 marks
A table allows direct lookup.
A graph alone may require estimating from a scale.
Include a table of exact counts, possibly alongside a graph.
Curriculum reference & lesson scope
Australian Curriculum v9 / SA Curriculum Mathematics
Year 9 sampling, comparative distributions, centre/spread/outliers, displays, critique and statistical investigations.
Official curriculum source ↗