
Understand the idea.
Four different summaries
The mean shares the total equally across all observations. The median locates the middle after ordering; for an even number of values, average the two middle observations. The mode is the most frequent value, while range measures largest minus smallest.
A frequency table compresses repeated values. Multiply each value by its frequency to recover its contribution to the total, then divide by the total frequency. Averaging only the distinct listed values gives each value equal weight even when their frequencies differ.
A suitable picture
Choose a display that fits the variable: columns suit categories or discrete values, lines can show change through ordered time, and dot plots or stem-and-leaf displays retain individual values. Label quantities, units and scales clearly so readers can interpret the picture.
Compare more than one feature: centre, spread, shape and unusual values describe different aspects of a distribution. For column heights, a zero baseline avoids exaggerating differences. A single average can conceal the variation visible in the original observations.
See the method in action.
Worked example 1
Find mean, median, mode and range for 2,3,3,4,8.
Worked solution
- 1
Check the ordered data and calculate the mean.
There are five observations, including both occurrences of 3.
- 2
Locate the middle observation.
The third of five ordered observations is the middle value.
- 3
Identify the most frequent value.
Three occurs twice, more often than any other value.
- 4
Measure the spread between the extremes.
Range uses largest minus smallest, rather than the middle observations.
Mean 4; median 3; mode 3; range 6.
Worked example 2
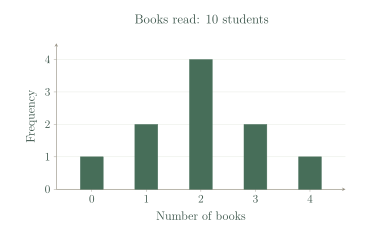
Use the supplied table to find mean books read.
| Books | Frequency |
|---|---|
| 0 | 1 |
| 1 | 2 |
| 2 | 4 |
| 3 | 2 |
| 4 | 1 |
Worked solution
- 1
Count all observations in the frequency table.
The frequencies count the people, not just the five distinct book totals.
- 2
Find the weighted book total.
Each book count contributes once for every person at that value.
- 3
Divide the total by the observation count.
Twenty books shared across ten observations gives the mean count.
2 books.
Try it yourself.
Check your understanding
Find the median of 2,4,7,9.
Show answer & reasoning
5.5.
With four ordered observations, the middle two are 4 and 7. Their average is , so the median can lie between observed values.
Keep practising
6 worksheet questions · 16 marks
Read the questions online
- Find the mean, median, mode and range of 5,6,6,7,11.4 marks
- How many students read at least 3 books in the supplied table?2 marks
Example data: books read in one week Books Frequency 0 1 1 2 2 4 3 2 4 1 - Find the median books read from the supplied table.2 marks
Example data: books read in one week Books Frequency 0 1 1 2 2 4 3 2 4 1 - A stem-and-leaf display has rows and , with key . List the data and range.3 marks
- Choose a display for rainfall measured daily across a fortnight. Explain.2 marks
- Columns for counts 45 and 50 start their vertical axis at 40. Explain the distortion.3 marks
Read the worked solutions
Equivalent correct methods earn the corresponding marks. Include units where asked.
- Find the mean, median, mode and range of 5,6,6,7,11.4 marks
Total 35; .
Middle value 6; 6 occurs twice; .
Mean 7; median 6; mode 6; range 6. - How many students read at least 3 books in the supplied table?2 marks
Example data: books read in one week Books Frequency 0 1 1 2 2 4 3 2 4 1 Add frequencies for 3 and 4 books: .
3 students. - Find the median books read from the supplied table.2 marks
Example data: books read in one week Books Frequency 0 1 1 2 2 4 3 2 4 1 The fifth and sixth observations are both 2.
2 books. - A stem-and-leaf display has rows and , with key . List the data and range.3 marks
Read place values from the key; .
12,14,16,20,23; range 11. - Choose a display for rainfall measured daily across a fortnight. Explain.2 marks
Ordered time allows day-to-day change to be seen.
A line graph with day horizontally and rainfall in millimetres vertically. - Columns for counts 45 and 50 start their vertical axis at 40. Explain the distortion.3 marks
Use a zero baseline for fair column-height comparisons.
Displayed heights 5 and 10 make 50 look twice 45, although actual counts differ by only 5.
Curriculum reference & lesson scope
Australian Curriculum v9 and SA Curriculum
Population, census and sample; observational versus experimental data; random and non-random sampling; primary/secondary data; reviewing numerical displays and summary statistics; comparing samples and sample sizes; bias, variation and uncertainty; planning, conducting and reporting a fair investigation.
Official curriculum source ↗