
Understand the idea.
Make a table before plotting
A rule turns each chosen input into an output. Record them together as : the first coordinate is horizontal and the second vertical. Including zero and negative inputs can reveal the shape clearly when those inputs are allowed.
Calculate at least three points when checking a straight-line rule. Two points locate a line, but a third offers an arithmetic check: if it misses the line, revisit its substitution and plotting.
Respect the context and scale
Label axes and use evenly spaced intervals on each axis. The horizontal and vertical scales may differ, but each must stay consistent. Plot the ordered pairs accurately before drawing a straight line with a ruler.
Connect points when the input can vary continuously. If the input counts tickets or people, only whole-number inputs make sense, so keep separate points. A formula alone does not decide which values the context permits.
See the method in action.
A table and graph
Graph using x = -2, -1, 0 and 1.
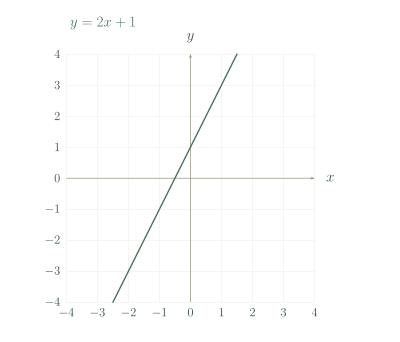
| x | -2 | -1 | 0 | 1 |
|---|---|---|---|---|
| y | -3 | -1 | 1 | 3 |
Worked solution
- 1
Calculate every requested output.
Each output must be paired with the input used to calculate it.
- 2
Write and plot the ordered pairs.
Place on the horizontal axis and on the vertical axis using consistent scales.
- 3
Draw the straight line through them.
The points have a constant rise per equal input step; the unrestricted rule allows intermediate inputs too.
Plot .
A point check
Does lie on ?
Worked solution
- 1
Read the proposed coordinates.
A point supplies both an input and a proposed output.
- 2
Calculate the output from the rule.
Substitution into the right side determines the output required at that input.
- 3
Compare with the second coordinate.
The output agrees, so lies on the graph.
Yes.
Try it yourself.
Check your understanding
Find the point on at x = 2.
Show answer & reasoning
.
At , substitute into the rule to get . Keep the input first when writing the point: .
Keep practising
6 worksheet questions · 15 marks
Read the questions online
- For , find outputs for .3 marks
- For , find outputs for .3 marks
- Is on ?2 marks
- Is on ?2 marks
- Draw for using a table.3 marks
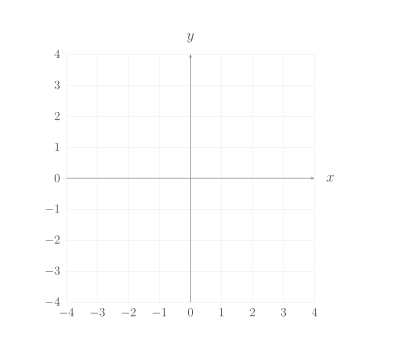
- Tickets cost AUD 4 each. Does the graph for ticket purchases contain ? Explain.2 marks
Read the worked solutions
Equivalent correct methods earn the corresponding marks. Include units where asked.
- For , find outputs for .3 marks
Add 3 to each input.
The pairs are .
1, 3 and 5. - For , find outputs for .3 marks
Double each input and subtract 1.
The pairs are .
-3, -1 and 3. - Is on ?2 marks
Substituting gives 7.
It matches the second coordinate.
Yes. - Is on ?2 marks
At , the output is 3.
The proposed output is 1.
No. - Draw for using a table.3 marks
Calculate three or more pairs.
Plot and join only over the stated interval.
A segment through .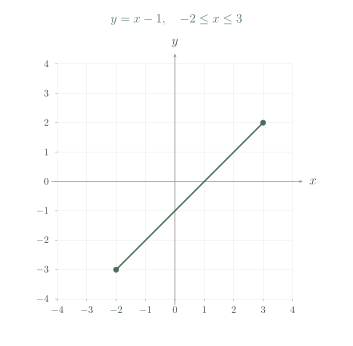
- Tickets cost AUD 4 each. Does the graph for ticket purchases contain ? Explain.2 marks
The input is a count of tickets.
Only non-negative whole-number inputs are realistic.
No, if tickets must be bought whole.
Curriculum reference & lesson scope
Australian Curriculum v9 and SA Curriculum Mathematics (2026)
Multi-step equations; brackets and variables on both sides; equations with rational solutions; substitution checks; one-variable inequalities and number-line solutions; tables and straight-line graphs; horizontal/vertical lines; how coefficients change a graph; graphical solutions and intersection checks; real-world linear models with digital exploration.
Official curriculum source ↗