
Understand the idea.
One point is one pair
Each scatterplot point represents paired data: two numerical measurements from the same person, object or occasion. The first coordinate belongs to the horizontal variable and the second to the vertical variable. Keep these two measurements linked throughout the analysis.
When one variable is used to explain another, place it horizontally and the response vertically. Label variables and units and choose scales that show the data clearly. This choice of axes helps interpretation but does not establish a cause.
Do not join unrelated observations
Plot observations as separate points. Joining unrelated people in table order would suggest a path that does not exist. Look across the whole cloud to describe the direction and shape, rather than requiring every consecutive point to rise or fall.
Investigate an unusual point before changing the data. It might reveal a recording error or an important difference in conditions. Removing it simply because it weakens the pattern gives a misleading account of the observed evidence.
See the method in action.
Plot and read paired data
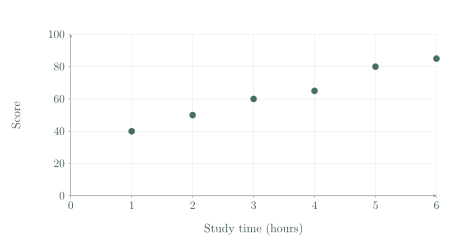
The table records study time and score for six students. Describe the overall pattern.
| Study(h) | Score |
|---|---|
| 1 | 40 |
| 2 | 50 |
| 3 | 60 |
| 4 | 65 |
| 5 | 80 |
| 6 | 85 |
Worked solution
- 1
Preserve each student's pair.
Each table row supplies one horizontal study time and its corresponding score.
- 2
Compare the direction across the observations.
The scores rise as the listed study times rise, indicating a positive association.
- 3
Describe the form without asserting an exact rule.
The points follow a roughly straight rising pattern, but their unequal score increases show they do not lie on one exact linear rule.
There is a positive, roughly linear association.
Keep pairing intact
Recorded pairs are (1, 8), (2, 3), (3, 6). Why is replacing them with (1, 3), (2, 6), (3, 8) wrong?
Worked solution
- 1
Compare the first individual before and after sorting.
The proposed replacement gives the first individual somebody else's response.
- 2
Check the remaining pairings.
Sorting the responses separately changes all three observations.
- 3
Explain the false pattern.
The altered responses increase with the first variable, manufacturing a positive pattern that was not the original paired evidence.
It destroys the original paired observations.
Try it yourself.
Check your understanding
A student's height is 165 cm and arm span 169 cm. If height is horizontal, what point is plotted?
Show answer & reasoning
(165, 169)
Height is horizontal, so it is the first coordinate. Arm span is vertical, giving the point .
Keep practising
6 worksheet questions · 13 marks
Read the questions online
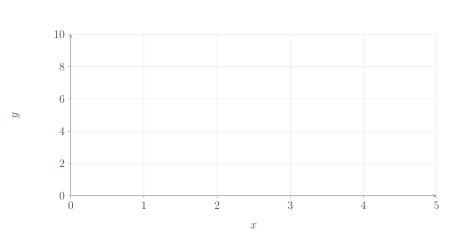
- Plot the pairs , , , on labelled axes.3 marks
- An experiment records water temperature after different heating times. Choose the horizontal variable.2 marks
- Read the score at study time 4 hours from the supplied plot.2 marks
- Why can height and shoe size be shown in a scatterplot but favourite colour and shoe size cannot be plotted the same way without extra conventions?2 marks
- A student sorts both columns independently before plotting. Explain the statistical error.2 marks
- A study covers ages 12–16. Why is a prediction for age 40 unsafe?2 marks
Read the worked solutions
Equivalent correct methods earn the corresponding marks. Include units where asked.
- Plot the pairs , , , on labelled axes.3 marks
Choose scales covering all values.
Keep each -value with its original -value.
Four separate points at the stated coordinates.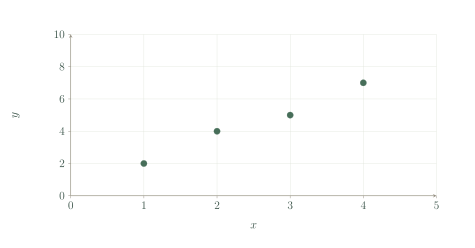
- An experiment records water temperature after different heating times. Choose the horizontal variable.2 marks
Time is the explanatory/input variable in this experiment.
Temperature is the response.
Heating time. - Read the score at study time 4 hours from the supplied plot.2 marks
Locate .
Read the corresponding observation's -coordinate.
65 - Why can height and shoe size be shown in a scatterplot but favourite colour and shoe size cannot be plotted the same way without extra conventions?2 marks
Height and shoe size have numerical coordinates.
Colour labels do not have a natural numerical scale.
A standard scatterplot needs two numerical variables; favourite colour is categorical. - A student sorts both columns independently before plotting. Explain the statistical error.2 marks
Each row belongs to one individual.
Independent sorting reassigns responses.
The pairings are changed, so the plot no longer represents the observations. - A study covers ages 12–16. Why is a prediction for age 40 unsafe?2 marks
The relationship may change beyond the sample's ages.
A scatterplot does not justify unlimited extrapolation.
It is far outside the observed range.
Curriculum reference & lesson scope
Australian Curriculum v 9 and SA Curriculum Mathematics
Year 10 continuous distributions, bivariate data, two-way categorical tables, bias and investigations, with the approved percentile and standard-deviation content included in the normal chapter.
Official curriculum source ↗