
Understand the idea.
Plan before collecting
Plan a bivariate investigation around a defined population and a question involving two measurements per individual. Specify variables, units and measurement procedures before collecting data. Choose a sampling method that fits the population and avoid unnecessary identifying details.
Anticipate errors and other influences. For revision time versus score, define what counts as revision and use comparable assessments. A precise recording method cannot overcome a sample that systematically excludes relevant people, so address measurement and selection separately.
Analyse, conclude and qualify
For two numerical variables, preserve the pairs and examine a labelled scatterplot. For two categorical variables, compare conditional percentages. Describe the observed pattern with evidence, investigate unusual observations and retain the original records so the analysis can be checked.
State sample size, selection method and limits. Separate association from causation, and predictions within the observed range from extrapolation beyond it. An honest inconclusive result is useful; a sound investigation does not require the initial prediction to be confirmed.
See the method in action.
A complete small numerical analysis
Six volunteers report weekly revision hours and a common quiz score. Analyse the supplied pairs.
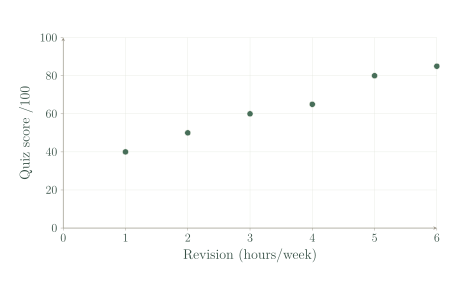
| Revision(h/week) | Quiz score/100 |
|---|---|
| 1 | 40 |
| 2 | 50 |
| 3 | 60 |
| 4 | 65 |
| 5 | 80 |
| 6 | 85 |
Worked solution
- 1
Identify the sample and measurements.
The six volunteers each supply revision hours and a score from a common quiz.
- 2
Plot the observations as pairs.
Keeping each row together preserves the connection between a volunteer's time and score.
- 3
Describe the observed pattern.
The plotted scores rise roughly linearly with revision hours, supporting a positive association in these data.
- 4
State the limits.
A small volunteer sample limits generalisation, and other differences between students prevent a conclusion that revision time alone caused the scores.
Positive roughly linear association in this small volunteer sample; no causal conclusion.
Improve a measurement plan
A group wants to compare arm span with height. They use different units and some wear shoes. Improve the plan.
Worked solution
- 1
Standardise units.
Using a common unit makes measurements directly comparable and avoids conversion mistakes.
- 2
Standardise measurement conditions.
Measure height without shoes and use consistent posture, equipment and technique for both variables.
- 3
Preserve pairing and improve selection.
Record each person's two measurements on the same row and sample fairly from the population of interest to reduce selection limitations.
Standardise units and measurement conditions, preserve pairs and improve sampling.
Try it yourself.
Check your understanding
Why must both measurements be recorded on the same row?
Show answer & reasoning
To preserve which two values belong to the same individual.
The row identifies which height and arm span came from the same person. Separating and rearranging the lists would change the plotted observations and could create a false association.
Keep practising
6 worksheet questions · 14 marks
Read the questions online
- Write a focused bivariate question about students that uses two numerical variables.2 marks
- State a consistent recording plan for height and arm span.2 marks
- Why might choosing only the basketball team limit a height/arm-span investigation about all Year 10 students?2 marks
- Describe the supplied revision/score pattern and one limitation.3 marks
- Give one reason not to predict the score for 20 revision hours from data covering 1–6 hours.2 marks
- A class finds no clear pattern. Write an honest conclusion and one improvement.3 marks
Read the worked solutions
Equivalent correct methods earn the corresponding marks. Include units where asked.
- Write a focused bivariate question about students that uses two numerical variables.2 marks
Specify a population.
Choose two measurable numerical variables.
For example:'Among Year 10 students, is height associated with arm span?' - State a consistent recording plan for height and arm span.2 marks
Use common units and precision.
Keep pairs together.
Measure both in centimetres with the same procedures; record paired values for each participant. - Why might choosing only the basketball team limit a height/arm-span investigation about all Year 10 students?2 marks
Team selection can relate to physical characteristics.
Use a wider sampling frame.
The selected group may not represent the full year. - Describe the supplied revision/score pattern and one limitation.3 marks
Scores tend to rise with reported revision hours.
Self-reporting and confounding also limit interpretation.
Positive roughly linear association; the small volunteer sample may be unrepresentative. - Give one reason not to predict the score for 20 revision hours from data covering 1–6 hours.2 marks
The relationship may not continue unchanged.
The sample does not support that range.
It is extrapolation far beyond the observed range. - A class finds no clear pattern. Write an honest conclusion and one improvement.3 marks
Do not change or hide data to support the prediction.
Improve a specific limitation rather than promise a different result.
No clear association was found in this sample; collect a larger, fairer sample with more consistent measurements.
Curriculum reference & lesson scope
Australian Curriculum v 9 and SA Curriculum Mathematics
Year 10 continuous distributions, bivariate data, two-way categorical tables, bias and investigations, with the approved percentile and standard-deviation content included in the normal chapter.
Official curriculum source ↗