
Understand the idea.
Make a balanced comparison
A useful comparison separates centre from spread. Name both groups, quote their medians, and compare IQRs or another suitable spread measure. Then explain the practical meaning: a lower delivery-time median suggests faster typical delivery, not necessarily greater consistency.
Also consider shape and unusual values when the display shows them. Similar medians can accompany very different spreads. A full range may be dominated by one extreme observation, so it need not describe the experience of the middle half well.
Use comparable data
Before comparing, check the units, measurement procedures and groups being measured. Sample sizes and selection methods affect generalisation. A neat numerical difference between samples does not by itself establish the same difference across the wider populations.
Write conclusions such as “in these samples” and identify the trade-off supported by the evidence. Quartile summaries cannot reveal every observation, the exact mean, or whether one group always outperforms another. State those limits when they affect the question.
See the method in action.
Compare delivery times
Sample A has median 18 min, IQR 8 min; sample B has median 22 min, IQR 4 min. Compare delivery times.
Worked solution
- 1
Compare typical delivery times.
A has a median four minutes lower than B, indicating faster typical delivery in these samples.
- 2
Compare central variability.
B has an IQR four minutes smaller, so its middle half is more consistent.
- 3
Explain the trade-off.
Typical speed favours A; central consistency favours B. The summaries do not establish one group is preferable for every purpose.
A is typically faster; B is more consistent in the central half.
Avoid a range-only judgement
A has summary 4, 8, 12, 16, 24; B has 6, 10, 11, 13, 20. Compare centres and spreads.
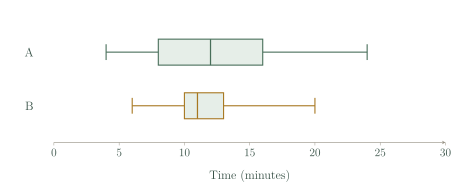
Worked solution
- 1
Compare the middle summary values.
The third number in each summary is the median; B has the lower centre.
- 2
Compare the central halves.
B has less central spread because its IQR is smaller.
- 3
Compare the complete spans.
B also has the smaller full range, supporting the spread conclusion by a second measure.
B has lower centre and smaller spread by both measures.
Try it yourself.
Check your understanding
Two samples both have median 30. Their IQRs are 4 and 12. What clear difference can you state?
Show answer & reasoning
The second sample has a wider middle-half spread.
The second sample has IQR , compared with , so its central half spans more units despite the shared median.
Keep practising
6 worksheet questions · 14 marks
Read the questions online
- Class A has mean 72, SD 6; class B has mean 72, SD 11. Compare.2 marks
- Bus A has median delay 5 min, IQR 2; Bus B median delay 3 min, IQR 6. State two differences.3 marks
- One sample is in centimetres and another in metres. What must you do before comparing spreads?2 marks
- A class has one unusually high score. Which is generally less affected: mean or median? Explain.2 marks
- A sample of 10 volunteers has a lower median than a random sample of 200. Can you conclude its population median is lower?2 marks
- Write a comparison using both plots.3 marks
Read the worked solutions
Equivalent correct methods earn the corresponding marks. Include units where asked.
- Class A has mean 72, SD 6; class B has mean 72, SD 11. Compare.2 marks
Centres coincide.
compares SD.
Same mean; A's scores are less spread around the mean. - Bus A has median delay 5 min, IQR 2; Bus B median delay 3 min, IQR 6. State two differences.3 marks
for centre.
for central spread.
B has lower typical delay; A has more consistent middle-half delays. - One sample is in centimetres and another in metres. What must you do before comparing spreads?2 marks
The numerical scales differ.
Use one unit for centres and spreads.
Convert to a common unit. - A class has one unusually high score. Which is generally less affected: mean or median? Explain.2 marks
The median depends on ordered position.
An extreme value can substantially change the total used for the mean.
Median. - A sample of 10 volunteers has a lower median than a random sample of 200. Can you conclude its population median is lower?2 marks
The volunteer sample may be biased and is small.
The observations describe the samples; generalisations need more evidence.
Not from these facts alone. - Write a comparison using both plots.3 marks
Read medians and quartiles on the common scale.
Keep the conclusion within the sampled groups.
B has median 11 min rather than 12 min and IQR 3 min rather than 8 min; B is slightly quicker and more consistent in these samples.
Curriculum reference & lesson scope
Australian Curriculum v 9 and SA Curriculum Mathematics
Year 10 continuous distributions, bivariate data, two-way categorical tables, bias and investigations, with the approved percentile and standard-deviation content included in the normal chapter.
Official curriculum source ↗