
Understand the idea.
Describe three separate features
Describe direction, strength and form separately. Positive means larger horizontal values tend to accompany larger vertical values; negative means they tend to accompany smaller ones. Form tells whether the pattern is approximately straight or curved.
Strength concerns how closely the points follow that pattern. A shallow line can have tightly clustered points and a steep line can have wide scatter. Changing axis units changes the apparent steepness without changing the underlying pairing or its consistency.
Curves can be strong too
A curved relationship can be very strong when points lie close to the curve. Do not call it weak merely because a straight line would fit poorly. Also check whether the direction remains the same across the displayed domain.
Describe unusual observations separately rather than hiding them in an overall label. They can influence fitted summaries and may suggest different conditions. An accurate description of association remains a statement about the observed pattern, rather than proof of causation.
See the method in action.
Describe a decreasing pattern
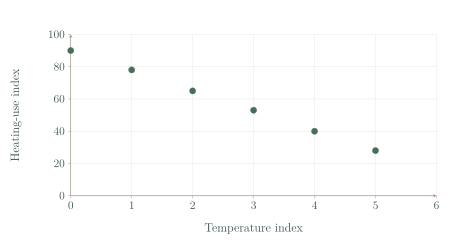
Describe the association between the outside-temperature index and heating-use index shown.
Worked solution
- 1
Identify the direction.
Heating-use index tends to decrease as outside-temperature index increases, so the direction is negative.
- 2
Assess scatter around the pattern.
The observations lie close to the decreasing pattern, supporting a strong association.
- 3
Name the form.
The pattern is approximately straight, so the full description is strong negative, approximately linear association.
Strong negative, approximately linear association.
Describe a curve
The pairs are (0, 0), (1, 1), (2, 4), (3, 9), (4, 16). Describe the pattern.
Worked solution
- 1
Check how the response changes.
Across the given nonnegative horizontal values, the response increases, giving positive direction.
- 2
Compare successive vertical increases.
Equal horizontal steps produce increasing vertical changes, so a straight line is unsuitable.
- 3
Identify the exact curved pattern.
Every listed point lies on the quadratic curve, giving a strong positive nonlinear association on this domain.
Strong positive nonlinear association, not a straight-line relationship.
Try it yourself.
Check your understanding
Points lie tightly around a decreasing straight line. Describe direction, strength and form.
Show answer & reasoning
Strong negative linear association.
Decreasing gives negative direction, tight clustering gives strong association, and the straight-line form gives linear: strong negative linear association.
Keep practising
6 worksheet questions · 12 marks
Read the questions online
- Describe the association for , , , , .2 marks
- Describe , , , , .2 marks
- Can a curved pattern be strong? Give a reason.2 marks
- A graph changes from metres to centimetres on one axis. Does that alone strengthen the association?2 marks
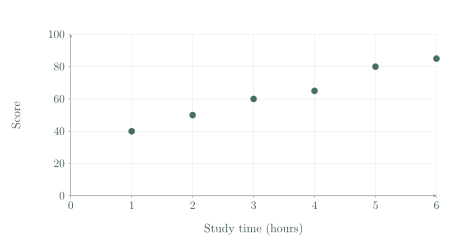
- Describe the supplied study-time plot using all three features.2 marks
- A single point lies far from the main pattern. State two sensible next steps.2 marks
Read the worked solutions
Equivalent correct methods earn the corresponding marks. Include units where asked.
- Describe the association for , , , , .2 marks
Every increase of 1 in gives a decrease of 2 in .
All points lie on .
Perfect negative linear association. - Describe , , , , .2 marks
The responses alternate rather than consistently rise or fall.
Five points alone offer limited evidence.
No clear linear direction; the points are scattered. - Can a curved pattern be strong? Give a reason.2 marks
Strength means closeness to a pattern.
Points may lie very close to a curve.
Yes. - A graph changes from metres to centimetres on one axis. Does that alone strengthen the association?2 marks
Only the unit scale changes.
The underlying paired observations and relative pattern are unchanged.
No. - Describe the supplied study-time plot using all three features.2 marks
Scores generally rise with study time.
There is some scatter around a roughly straight trend.
Positive, quite strong, approximately linear association. - A single point lies far from the main pattern. State two sensible next steps.2 marks
An unusual point is not automatically wrong.
Report and justify any later exclusion.
Check the recording/measurement and investigate its context.
Curriculum reference & lesson scope
Australian Curriculum v 9 and SA Curriculum Mathematics
Year 10 continuous distributions, bivariate data, two-way categorical tables, bias and investigations, with the approved percentile and standard-deviation content included in the normal chapter.
Official curriculum source ↗