
Understand the idea.
Cumulative means running total
Cumulative frequency is a running count. Add each class frequency to the previous total and check that the final total equals the sample size. Recover an individual class frequency by subtracting its preceding cumulative total.
For individual ordered data, use the stated nearest-rank convention: the th percentile occupies position for . The ceiling means round the position upward, rather than round to the nearest integer.
Read a grouped percentile carefully
For a grouped cumulative graph, calculate the desired fraction of the total on the vertical axis, move across to the graph, then down to the measurement axis. A target between class boundaries requires an estimate, because exact measurements are hidden.
Straight-line interpolation assumes a uniform spread within that class. Find how far the target count lies through the class, and use the same fraction of its width. A percentile describes a distribution position; it does not predict every individual measurement.
See the method in action.
A nearest-rank percentile
The ordered scores are 10, 12, 14, 16, 18, 20, 22, 24, 26, 28. Find P70 using nearest rank.
Worked solution
- 1
Convert the percentile to a rank.
Nearest rank rounds the percentile position upward.
- 2
Count to that ordered position.
The list is already in ascending order, so its seventh score is the required value.
- 3
State the percentile.
This is the observed value at the selected rank, not seventy per cent of the maximum.
P70=22.
Estimate from a cumulative graph
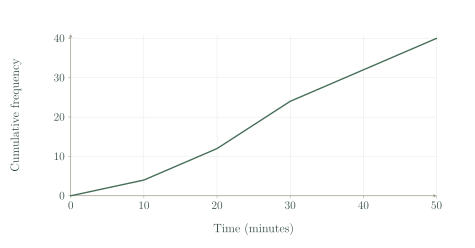
Estimate the median completion time for the 40 times shown.
Worked solution
- 1
Locate the halfway count.
The grouped median corresponds to half the cumulative total.
- 2
Locate the class containing that count.
The graph rises from count twelve to twenty-four between twenty and thirty minutes.
- 3
Find the fraction through the class.
Eight of the twelve class observations are needed to reach the target count.
- 4
Apply that fraction to the class width.
Linear interpolation assumes the observations are uniformly spread through this class.
Estimated median 26.7 minutes, assuming uniform spread within the 20–30 minute class.
Try it yourself.
Check your understanding
Cumulative totals are 5, 13, 20. How many observations are in the second class?
Show answer & reasoning
8
The second class adds the observations between cumulative totals five and thirteen: .
Keep practising
6 worksheet questions · 12 marks
Read the questions online
- Frequencies are 3, 7, 4, 6. Write the cumulative frequencies.2 marks
- Cumulative frequencies are 4, 11, 19, 25. Find the original frequencies.2 marks
- For ordered values 2, 4, 6, 8, 10, 12, 14, 16, 18, 20, find by nearest rank.2 marks
- A sample has 60 values. Which rank gives under nearest rank?2 marks
- Use the graph to estimate for 40 times.2 marks
- A graph puts at 45 minutes. Explain this in context.2 marks
Read the worked solutions
Equivalent correct methods earn the corresponding marks. Include units where asked.
- Frequencies are 3, 7, 4, 6. Write the cumulative frequencies.2 marks
Start with 3.
Add each next frequency to the running total.
3, 10, 14, 20. - Cumulative frequencies are 4, 11, 19, 25. Find the original frequencies.2 marks
First frequency 4.
Successive differences:, , .
4, 7, 8, 6. - For ordered values 2, 4, 6, 8, 10, 12, 14, 16, 18, 20, find by nearest rank.2 marks
.
The eighth value is 16.
16 - A sample has 60 values. Which rank gives under nearest rank?2 marks
.
15th - Use the graph to estimate for 40 times.2 marks
.
Cumulative 32 corresponds to 40 minutes.
40 minutes - A graph puts at 45 minutes. Explain this in context.2 marks
A percentile locates an ordered position.
It does not give the probability that every future task finishes by 45 minutes.
About 90% of recorded completion times are 45 minutes or less.
Curriculum reference & lesson scope
Australian Curriculum v 9 and SA Curriculum Mathematics
Year 10 continuous distributions, bivariate data, two-way categorical tables, bias and investigations, with the approved percentile and standard-deviation content included in the normal chapter.
Official curriculum source ↗