
Understand the idea.
The box measures the middle half
The interquartile range, , measures the numerical width of the central half of the ordered data. Because it does not use the minimum or maximum, moving one already extreme observation farther away may change the range while leaving the IQR unchanged.
On a box plot, read the box ends as and and its internal line as the median. Here the whiskers reach the minimum and maximum. Other conventions stop whiskers before outliers, so establish the rule before reading a range.
Compare on a common scale
Compare plots using the same scale and units. State the medians to compare typical values, then calculate the IQRs to compare central spread. Link any preference to the context: shorter waits and higher scores do not favour the same direction.
A wide section of a box represents a wider interval of values, not necessarily more observations. Box plots alone do not reveal sample size or the mean. Restrict a conclusion to the summaries the plots actually display.
See the method in action.
Read a box plot
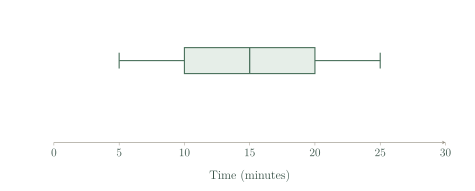
For this waiting-time box plot, find the median, IQR and full range.
Worked solution
- 1
Read the median line.
The internal vertical line marks the central ordered position.
- 2
Calculate the box width.
The box extends from the lower to the upper quartile.
- 3
Calculate the full span.
These whiskers mark the maximum and minimum.
Median 15 min; IQR 10 min; range 20 min.
Compare two groups
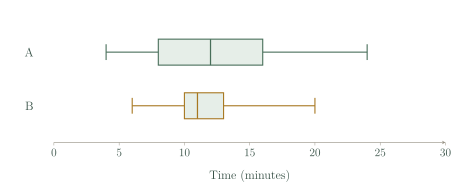
Group A has summary 4, 8, 12, 16, 24; Group B has 6, 10, 11, 13, 20. Compare typical times and spread.
Worked solution
- 1
Compare the medians.
B has the lower typical time by one minute.
- 2
Calculate both central spreads.
Each IQR subtracts the first quartile from the third.
- 3
Interpret the smaller IQR.
B combines a lower median with less variation across its central half; this does not say every B time is lower.
B has lower median time and a smaller IQR.
Try it yourself.
Check your understanding
Q1=14 and Q3=23. What is the IQR?
Show answer & reasoning
9
The IQR is the upper quartile minus the lower quartile: .
Keep practising
6 worksheet questions · 14 marks
Read the questions online
- Calculate IQR when cm and cm.2 marks
- State the five-number summary shown.2 marks
- Draw a labelled box plot for the summary 2, 5, 8, 11, 15 seconds.3 marks
- A: median 20, IQR 6. B: median 24, IQR 4. Compare the typical mass and central spread.3 marks
- Can a box plot alone tell you the exact mean? Explain.2 marks
- Two plots use horizontal scales 0–20 and 0–100. Why should you redraw them before comparing box widths?2 marks
Read the worked solutions
Equivalent correct methods earn the corresponding marks. Include units where asked.
- Calculate IQR when cm and cm.2 marks
.
4.5 cm - State the five-number summary shown.2 marks
Read the two whisker ends, the box ends and the median line in order.
5, 10, 15, 20, 25 minutes - Draw a labelled box plot for the summary 2, 5, 8, 11, 15 seconds.3 marks
Choose a consistent scale covering 2 to 15.
Mark all five summary values; join the box and whiskers.
Whiskers at 2 and 15; box from 5 to 11; median at 8, on a seconds scale.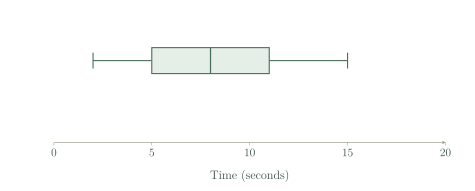
- A: median 20, IQR 6. B: median 24, IQR 4. Compare the typical mass and central spread.3 marks
compares medians.
compares IQRs.
B has higher median mass and smaller central spread. - Can a box plot alone tell you the exact mean? Explain.2 marks
A box plot supplies five positions, not every observation.
Different data sets with that summary may have different means.
No. - Two plots use horizontal scales 0–20 and 0–100. Why should you redraw them before comparing box widths?2 marks
A centimetre on the page represents different amounts.
Use a common numerical scale for a fair visual comparison.
The different scales distort apparent spread.
Curriculum reference & lesson scope
Australian Curriculum v 9 and SA Curriculum Mathematics
Year 10 continuous distributions, bivariate data, two-way categorical tables, bias and investigations, with the approved percentile and standard-deviation content included in the normal chapter.
Official curriculum source ↗