
Understand the idea.
Area under the curve represents a proportion
A normal model is a continuous, symmetric, bell-shaped distribution. Its mean fixes the centre and its standard deviation fixes the horizontal scale. The ideal model has equal mean, median and mode.
Total area under the curve is . An interval probability is the area above that interval, rather than the curve's height. A single exact value has zero probability in this continuous model, although any interval around it can have positive probability.
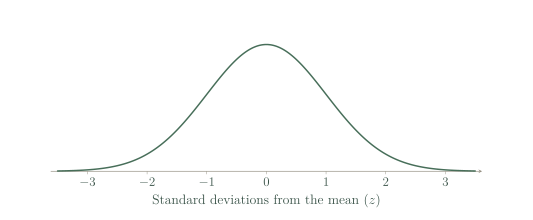
Use the empirical rule as an approximation
The 68–95–99.7 rule estimates the proportions within one, two and three standard deviations of a normal mean. These are central intervals extending equally to both sides; symmetry splits each remaining outside proportion equally between the tails.
These percentages are rounded approximations, useful when an estimate is requested. Use normal-distribution technology for more accurate probabilities, and check that a bell-shaped normal model is reasonable before applying the rule to measured data, especially if the data are strongly skewed.
See the method in action.
A central interval
A normal model has mean 70 and standard deviation 8. Estimate the proportion between 54 and 86.
Worked solution
- 1
Measure each endpoint from the mean.
Dividing each difference by 8 expresses the endpoint in standard deviations.
- 2
Identify the central normal interval.
The interval extends exactly two standard deviations either side of the mean.
- 3
Apply the empirical rule.
About 95% of a normal model lies within two standard deviations, so the estimated proportion is 95%.
About 95%.
An upper tail
Bottle-fill volumes are approximately normal with mean 500 mL and standard deviation 4 mL. Estimate how many of 2,000 bottles exceed 508 mL.
Worked solution
- 1
Locate the upper cutoff.
The 508 mL cutoff is two standard deviations above the mean.
- 2
Find the approximate upper-tail proportion.
The central 95% leaves about 5% outside, split equally between the two tails.
- 3
Convert the proportion into an expected count.
The empirical-rule estimate is about 50 bottles; the actual count in a batch can vary.
About 50 bottles.
Try it yourself.
Check your understanding
Estimate the proportion below the mean in a normal model.
Show answer & reasoning
50%.
A normal curve is symmetric about its mean and has no probability concentrated at one point. Half its area lies below the mean, giving .
Keep practising
6 worksheet questions · 13 marks
Read the questions online
- A normal model has mean 30 and sd 5. Give the interval containing about 68%.2 marks
- For the same model, estimate the proportion above 40.2 marks
- Estimate the proportion between the mean and 1 standard deviation above it.2 marks
- Estimate the proportion more than 3 standard deviations from the mean.2 marks
- A normal model has mean 100 and sd 15. Estimate how many of 800 observations lie from 85 to 115.2 marks
- A distribution of waiting times has a long right tail. Is it justified to assume 68% lie within one sd? Explain.3 marks
Read the worked solutions
Equivalent correct methods earn the corresponding marks. Include units where asked.
- A normal model has mean 30 and sd 5. Give the interval containing about 68%.2 marks
Use mean standard deviation.
25 to 35. - For the same model, estimate the proportion above 40.2 marks
40 is 2 standard deviations above 30; split the 5% outside standard deviations into two tails.
About 2.5%. - Estimate the proportion between the mean and 1 standard deviation above it.2 marks
Take half of the central 68%.
About 34%. - Estimate the proportion more than 3 standard deviations from the mean.2 marks
, including both tails.
About 0.3%. - A normal model has mean 100 and sd 15. Estimate how many of 800 observations lie from 85 to 115.2 marks
The interval is standard deviation, so .
About 544. - A distribution of waiting times has a long right tail. Is it justified to assume 68% lie within one sd? Explain.3 marks
The empirical rule is specific to an approximately normal shape.
A long right tail gives reason to question that model.
No, not from that information.
Curriculum reference & lesson scope
SACE Board of South Australia
Stage 1 Mathematics: counting, binomial expansion, data, samples, summary measures and introductory normal distributions. These lessons provide the Counting and Statistics strand of the approved Methods preparation route.
Official curriculum source ↗