
Understand the idea.
Use comparable measures and a common scale
Compare centre and spread together: a higher typical value says nothing by itself about consistency. Use common units and the same graphical scale. For skewed data or strong outliers, median and IQR usually give a more resistant comparison.
Mean and standard deviation are useful for reasonably symmetric distributions without dominant outliers. Range uses only two endpoints, so one unusual value can make it large even when most observations are tightly clustered. Describe any relevant difference in shape too.
Separate description from explanation
A useful comparison names the groups, gives the direction and size of the difference, and interprets it in context. Overlapping box plots do not support a claim that every observation in one group exceeds every observation in the other.
Describing a sample difference is separate from explaining its cause. Consider sample size, selection and other differing conditions. Observational summaries alone do not establish that group membership caused the difference or that the pattern applies to the whole population.
See the method in action.
Compare the supplied box plots
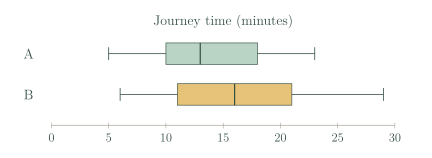
For the supplied journey-time box plots, compare typical time and consistency.
Worked solution
- 1
Compare the medians.
The median line is at 13 minutes for A and 16 minutes for B, so B has the higher typical journey time.
- 2
Compare the interquartile ranges.
A has the narrower central half and is more consistent by this measure.
- 3
Compare the full ranges.
The full observed span is also smaller for A.
- 4
State the limits of the comparison.
The plotted ranges overlap, so the comparison does not rank every individual journey; these summaries alone do not establish a cause.
B has a higher median journey time by 3 min; A has the smaller IQR and range.
An outlier changes the preferred summary
Set A is 4,5,5,6,30; set B is 7,8,8,9,10. Which group has the higher typical score?
Worked solution
- 1
Calculate the means for comparison.
The unusually large 30 makes the mean of A exceed the mean of B.
- 2
Locate the medians.
Each ordered list contains five values, so the third value is the median.
- 3
Compare the centres using a resistant measure.
The outlier in A makes median the more informative description of the central scores; B has the higher typical score by 3.
Using medians, B is higher:8 versus 5. A's mean 10 is distorted by 30.
Try it yourself.
Check your understanding
A has median 12/IQR 4 and B median 15/IQR 9. Which is more consistent in its central half?
Show answer & reasoning
A.
A has IQR while B has IQR . The central half of A occupies the smaller interval, so A is more consistent by this measure, despite its lower median.
Keep practising
6 worksheet questions · 15 marks
Read the questions online
- Group A has median 18 and IQR 6. Group B has median 22 and IQR 4. Compare both features.2 marks
- Two groups have equal means but standard deviations 2 and 7. What differs?2 marks
- Why is a common horizontal scale essential for two box plots?2 marks
- Compare 1,2,2,3,12 with 4,4,5,5,6 using medians. Mention a reason not to rely only on means.3 marks
- A study samples 12 volunteers in A and 100 randomly selected people in B. Give two cautions about comparing the results.3 marks
- Class A's score range is 40 and Class B's is 25. A student says every A score is more variable than every B score. Explain the error.3 marks
Read the worked solutions
Equivalent correct methods earn the corresponding marks. Include units where asked.
- Group A has median 18 and IQR 6. Group B has median 22 and IQR 4. Compare both features.2 marks
B is typically higher and its central half is less spread out.
B has a 4-unit higher median and a 2-unit smaller IQR. - Two groups have equal means but standard deviations 2 and 7. What differs?2 marks
Equal centres do not imply equal variation.
The second group has greater spread around its mean. - Why is a common horizontal scale essential for two box plots?2 marks
Compare numerical positions and lengths on one consistent unit scale.
Different scales can make equal spreads appear unequal or reverse a visual comparison. - Compare 1,2,2,3,12 with 4,4,5,5,6 using medians. Mention a reason not to rely only on means.3 marks
The 12 in the first group is an outlier that pulls its mean upwards.
Medians 2 and 5, so the second group has a higher central value. - A study samples 12 volunteers in A and 100 randomly selected people in B. Give two cautions about comparing the results.3 marks
A observed difference may reflect selection rather than the groups themselves.
The different sample sizes affect stability; volunteers in A may differ systematically from non-volunteers. - Class A's score range is 40 and Class B's is 25. A student says every A score is more variable than every B score. Explain the error.3 marks
A larger range only describes the two endpoints.
It does not determine IQR, standard deviation or all observations.
Variation describes a distribution, not each individual value.
Curriculum reference & lesson scope
SACE Board of South Australia
Stage 1 Mathematics: counting, binomial expansion, data, samples, summary measures and introductory normal distributions. These lessons provide the Counting and Statistics strand of the approved Methods preparation route.
Official curriculum source ↗