
Understand the idea.
Describe the whole pattern
A distribution describes how observations are spread over values. Look for clusters, gaps, roughly matching sides and long tails. In a right-skewed distribution the longer tail extends to larger values; in a left-skewed distribution it extends to smaller values.
Name the skew by its tail, not by where most observations sit. Use actual values to support the description, especially for small datasets. A few observations can suggest a pattern without establishing a precise model for a larger population.
Unusual is not the same as wrong
An outlier is unusually far from the main group. Investigate its source before deciding what to do: it might be a recording error, a different condition, or a genuine observation belonging to the investigation.
A genuine extreme value remains evidence. It can pull the mean towards itself and enlarge the range. The median depends on middle positions and is often less affected. Explain an unusual value’s influence rather than deleting it merely to simplify the pattern.
See the method in action.
Investigate a high reading
Eight daily temperatures are 18, 19, 19, 20, 20, 21, 21, 38°C. Describe the unusual value and compare mean and median.
Worked solution
- 1
Locate the main group and the unusual reading.
Seven readings lie between eighteen and twenty-one; thirty-eight lies well above that cluster.
- 2
Calculate the mean of all eight readings.
The total is one hundred and seventy-six, including the high reading.
- 3
Average the two middle ordered readings.
The fourth and fifth positions determine the median of eight values.
- 4
Investigate rather than automatically remove the high value.
Thirty-eight is a possible outlier. If it is a genuine day in the stated period, retain it and explain that it raises the mean above the median.
38°C is a possible outlier; mean 22°C and median 20°C. The high value pulls the mean upwards.
Read the direction of a tail
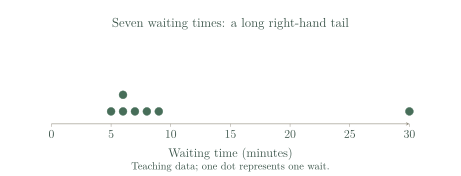
Waiting times in minutes are 5, 6, 6, 7, 8, 9, 30. Describe the shape.
Worked solution
- 1
Identify where most waiting times lie.
Six of the seven waits cluster between five and nine minutes.
- 2
Locate the tail.
The isolated longer wait extends the distribution towards larger values on the right.
- 3
Describe the shape in context.
The distribution is right-skewed, with an unusually long thirty-minute wait relative to the main group.
Right-skewed, with an unusually long wait of 30 minutes.
Try it yourself.
Check your understanding
Most values are near 40, with a tail stretching down to 5. Which direction is the skew?
Show answer & reasoning
Left-skewed.
The tail extends from the main group near down towards the smaller value . Smaller values lie to the left, so the distribution is left-skewed.
Keep practising
6 worksheet questions · 12 marks
Read the questions online
- Describe the main cluster and an unusual value in 7, 8, 8, 9, 9, 10, 28.2 marks
- Why is “28 is different, so remove it” not enough justification?2 marks
- For 3, 4, 4, 5, 24, find the mean and median.2 marks
- A graph has a long tail towards large values. Is it left-skewed or right-skewed?2 marks
- The minimum is 12 and maximum 31. A genuine new observation of 50 is included. What happens to the range?2 marks
- A recorded plant height is 420 cm while other seedlings are 4–8 cm. Name two things to check before using it.2 marks
Read the worked solutions
Equivalent correct methods earn the corresponding marks. Include units where asked.
- Describe the main cluster and an unusual value in 7, 8, 8, 9, 9, 10, 28.2 marks
Six observations lie between 7 and 10; one is well above them.
Main cluster 7–10; 28 is unusually high. - Why is “28 is different, so remove it” not enough justification?2 marks
Check recording conditions and the source before deciding whether it is an error.
A genuine relevant observation must not be removed merely because it is unusual. - For 3, 4, 4, 5, 24, find the mean and median.2 marks
The total is 40, so .
The middle ordered observation is 4.
Mean 8; median 4. - A graph has a long tail towards large values. Is it left-skewed or right-skewed?2 marks
Large values lie to the right on the number axis.
Right-skewed. - The minimum is 12 and maximum 31. A genuine new observation of 50 is included. What happens to the range?2 marks
.
.
It increases from 19 to 38. - A recorded plant height is 420 cm while other seedlings are 4–8 cm. Name two things to check before using it.2 marks
Review the original measurement and recording rules rather than inventing a correction.
For example, whether 4.20 cm was mistyped as 420 cm, and whether the same units or type of plant were used.
Curriculum reference & lesson scope
Australian Curriculum v9 / South Australian Mathematics Curriculum
Year 7 statistical variables, representations, summary statistics, outliers and an original small investigation; deeper sampling methods develop in Year 8.
Official curriculum source ↗