
Understand the idea.
Keep the observations visible
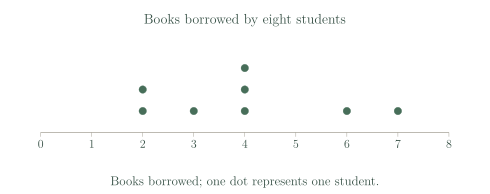
A dot plot places one dot above the value of each observation. Repeated values stack directly above one another; their stack height gives the frequency. Moving repeated dots sideways to nearby numbers would change the recorded data.
Look across the plot for clusters, gaps and isolated values. Count all the dots to check the dataset size. For questions such as “at least six”, include six itself as well as every larger value shown.
Read the key before the leaves
A stem-and-leaf plot separates each number into two parts while retaining every observation. Read its key first: might represent or . The same printed stem and leaf can represent different quantities.
List stems in order and arrange each row’s leaves from smallest to largest. Keep repeated leaves because each represents a separate observation. Include empty stems when needed to reveal a gap, and write a key with the correct unit.
| Stem | Leaves |
|---|---|
| 1 | 1 2 2 3 5 8 |
| 2 | 0 1 1 4 |
See the method in action.
Read repeated dots
How many students in the dot plot borrowed four books, and how many borrowed at least six?
Worked solution
- 1
Count the dots directly above four.
Each of the three stacked dots represents one student who borrowed four books.
- 2
Include every value at least six.
“At least” includes six and the larger observed value seven.
- 3
State the two counts in context.
The first count concerns exactly four books, while the second combines six or more.
Three students borrowed four books; two borrowed at least six.
Construct an ordered stem plot
Show 24, 25, 29, 31, 31, 36 in a stem-and-leaf table with leaf unit 1.
| Stem | Leaves |
|---|---|
| 2 | 4 5 9 |
| 3 | 1 1 6 |
Worked solution
- 1
Separate tens from units.
With leaf unit one, the tens digits form the stems.
- 2
Order the leaves for each stem.
Both copies of thirty-one must remain as separate leaves.
- 3
Supply the key and check the count.
The key defines the place values and six leaves preserve all six observations.
2 | 4 5 9 and 3 | 1 1 6; key 2 | 4 = 24.
Try it yourself.
Check your understanding
A plot has key 3 | 7 = 3.7 kg. What does 4 | 2 mean?
Show answer & reasoning
4.2 kg.
The key assigns whole kilograms to stems and tenths to leaves. Therefore .
Keep practising
6 worksheet questions · 12 marks
Read the questions online
- List all values shown by the stem plot.2 marks
cm; key means 12 cm Stem Leaves 1 1 2 2 3 5 8 2 0 1 1 4 - How many observations are in the stem plot?2 marks
cm; key means 12 cm Stem Leaves 1 1 2 2 3 5 8 2 0 1 1 4 - Construct an ordered stem plot for 14, 18, 18, 21, 23, 25. Include a key.2 marks
- State the most frequent value in the dot plot.2 marks
- How many students in the dot plot borrowed fewer than four books?2 marks
- A stem plot shows but gives no key or units. Explain why it is incomplete.2 marks
Read the worked solutions
Equivalent correct methods earn the corresponding marks. Include units where asked.
- List all values shown by the stem plot.2 marks
cm; key means 12 cm Stem Leaves 1 1 2 2 3 5 8 2 0 1 1 4 Read every leaf, including repeated 2s and 1s.
11, 12, 12, 13, 15, 18, 20, 21, 21, 24 cm. - How many observations are in the stem plot?2 marks
cm; key means 12 cm Stem Leaves 1 1 2 2 3 5 8 2 0 1 1 4 There are 6 leaves in the first row and 4 in the second: .
10. - Construct an ordered stem plot for 14, 18, 18, 21, 23, 25. Include a key.2 marks
Separate tens and ones.
Order the leaves and retain both 18s.
; ; key .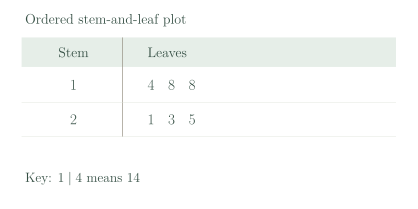
- State the most frequent value in the dot plot.2 marks
Three dots stack above 4, more than above any other value.
4 books. - How many students in the dot plot borrowed fewer than four books?2 marks
The values below 4 are 2, 2 and 3.
3 students. - A stem plot shows but gives no key or units. Explain why it is incomplete.2 marks
A key and units define the value represented by each stem–leaf combination.
The reader cannot know whether it means 53, 5.3 or another scale, or what is measured.
Curriculum reference & lesson scope
Australian Curriculum v9 / South Australian Mathematics Curriculum
Year 7 statistical variables, representations, summary statistics, outliers and an original small investigation; deeper sampling methods develop in Year 8.
Official curriculum source ↗