
Understand the idea.
Frequency counts observations
Frequency is the number of observations in a category or at a value. Tally each record once, then count the tallies. The sum of the frequencies should equal the number of valid responses; a mismatch signals a counting or classification problem.
Use separate bars to compare categories such as travel methods. Label category names and frequency, choose equal-width bars and a clear scale, and include a title describing the group. A frequency axis starting at zero supports fair bar-length comparisons.
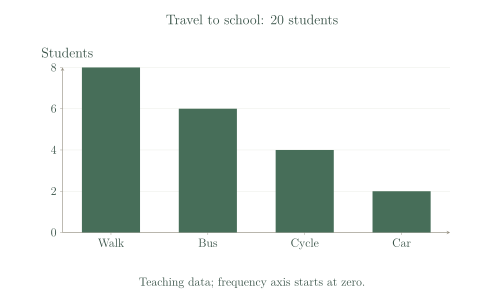
| Method | Frequency |
|---|---|
| Walk | 8 |
| Bus | 6 |
| Cycle | 4 |
| Car | 2 |
Choose the graph for the question
Choose a graph to suit the variable and the question. A dot plot keeps individual numerical observations visible. A bar graph compares categories. A line graph can show a measurement changing over ordered time, such as temperatures recorded hourly.
Joining points suggests a meaningful sequence between them, so do not connect unrelated categories such as bus and car. Label numerical axes with units, and remember that joined segments between timed observations do not add new measured readings.
See the method in action.
Complete a frequency table
The books borrowed by eight students are 0, 1, 1, 2, 2, 2, 3, 4. Give the frequencies.
| Books | Frequency |
|---|---|
| 0 | 1 |
| 1 | 2 |
| 2 | 3 |
| 3 | 1 |
| 4 | 1 |
Worked solution
- 1
Count the lower observed values.
Zero occurs once and one occurs twice in the eight records.
- 2
Count the remaining observed values.
Every observation contributes to exactly one frequency.
- 3
Check the frequency total.
The total matches the eight students, so no record has been lost or counted twice.
Frequencies for 0, 1, 2, 3, 4 are 1, 2, 3, 1, 1.
A suitable time graph
A thermometer is read at 9 am, 10 am, 11 am and noon. The temperatures are 16°C, 18°C, 21°C and 23°C. Choose a display.
Worked solution
- 1
Place the ordered times on the horizontal axis.
Time provides a meaningful order for the observations.
- 2
Plot each measured temperature.
Label the vertical axis as temperature in degrees Celsius and pair each value with its time.
- 3
Use a labelled line graph to show the change.
Joining consecutive readings highlights the time pattern; the connecting lines are not extra thermometer measurements.
A labelled line graph is suitable; horizontal axis time, vertical axis temperature (°C).
Try it yourself.
Check your understanding
The frequencies in a survey of 18 students add to 20. Is the table ready to graph?
Show answer & reasoning
No.
No. Frequencies totalling cannot represent exactly single responses without an inconsistency. Recheck tallies, category rules and the stated total before graphing.
Keep practising
6 worksheet questions · 12 marks
Read the questions online
- Make a frequency table for 1, 2, 2, 3, 3, 3, 4, 4.2 marks
- Using the travel table, how many more students walk than travel by car?2 marks
Travel to school: teaching data for 20 students Method Frequency Walk 8 Bus 6 Cycle 4 Car 2 - Using the travel table, what fraction of the students cycle? Give a simplest fraction.2 marks
Travel to school: teaching data for 20 students Method Frequency Walk 8 Bus 6 Cycle 4 Car 2 - Choose a display for favourite school subjects: a bar graph or line graph. Explain.2 marks
- Frequencies are 5, 7, 3 and one missing frequency. There are 21 responses. Find the missing frequency.2 marks
- A student draws the “Cycle” bar twice as wide as the others. Why could this mislead?2 marks
Read the worked solutions
Equivalent correct methods earn the corresponding marks. Include units where asked.
- Make a frequency table for 1, 2, 2, 3, 3, 3, 4, 4.2 marks
Count each score once.
The frequencies total 8.
1:1, 2:2, 3:3, 4:2. - Using the travel table, how many more students walk than travel by car?2 marks
Travel to school: teaching data for 20 students Method Frequency Walk 8 Bus 6 Cycle 4 Car 2 .
6 students. - Using the travel table, what fraction of the students cycle? Give a simplest fraction.2 marks
Travel to school: teaching data for 20 students Method Frequency Walk 8 Bus 6 Cycle 4 Car 2 4 of 20 cycle.
.
. - Choose a display for favourite school subjects: a bar graph or line graph. Explain.2 marks
School subjects are categories, so separate bars compare their frequencies.
A bar graph. - Frequencies are 5, 7, 3 and one missing frequency. There are 21 responses. Find the missing frequency.2 marks
Known frequencies total .
.
6. - A student draws the “Cycle” bar twice as wide as the others. Why could this mislead?2 marks
Use equal bar widths and compare heights on the same frequency scale.
Its extra area can make the category look more important than its frequency justifies.
Curriculum reference & lesson scope
Australian Curriculum v9 / South Australian Mathematics Curriculum
Year 7 statistical variables, representations, summary statistics, outliers and an original small investigation; deeper sampling methods develop in Year 8.
Official curriculum source ↗