
Understand the idea.
Read what the axes measure
Read the quantities, units and tick values before describing a graph. A rising distance-from-home graph shows increasing distance from home. A horizontal section shows that this measured distance stays constant; its height tells you what that distance is.
In the supplied journey model, the section from minute to minute is horizontal at kilometres. It can represent a stop in a simple outward journey, but distance from home alone does not describe every possible movement.
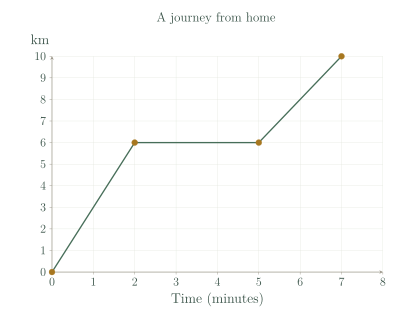
| Time (min) | Distance from home (km) |
|---|---|
| 0 | 0 |
| 2 | 6 |
| 5 | 6 |
| 7 | 10 |
Compare intervals and avoid overclaims
Compare changes over stated intervals. A larger temperature fall over the same time means faster average cooling. Over unequal intervals, compare change per unit of time rather than just the total vertical change.
Keep conclusions within the information supplied. Joining measured points models what happened between readings; it does not prove it. A graph ending at minute gives no certain value at minute without an additional assumption.
See the method in action.
A flat interval
What happens from minute 2 to minute 5 in the journey log?
| Time (min) | Distance from home (km) |
|---|---|
| 0 | 0 |
| 2 | 6 |
| 5 | 6 |
| 7 | 10 |
Worked solution
- 1
Read the two endpoint distances.
The graph shows a horizontal section joining these readings.
- 2
Find the change in distance from home.
The vertical value stays at 6 km throughout the modelled flat section.
- 3
Calculate the interval length.
The distance from home remains 6 km for these 3 minutes, rather than being zero.
Distance from home remains at 6 km for 3 minutes.
Compare cooling
Temperatures are 80,65,55,50°C at times 0,2,4,6 min. When is the greatest two-minute fall?
| Time (min) | Temperature (°C) |
|---|---|
| 0 | 80 |
| 2 | 65 |
| 4 | 55 |
| 6 | 50 |
Worked solution
- 1
Calculate each temperature fall.
Subtract the later temperature from the earlier one to express each decrease as a positive amount.
- 2
Compare intervals of equal duration.
Each fall occurs over the same 2-minute interval, so the fall amounts can be compared directly.
- 3
Select the greatest fall.
The largest two-minute fall is 15 degrees Celsius, during minutes 0 to 2.
During 0–2 minutes.
Try it yourself.
Check your understanding
A distance-from-home graph is flat at 5 km. Is the person at home?
Show answer & reasoning
No. The distance from home remains 5 km.
No. The graph is flat at a distance of km, so that distance stays unchanged. At home, the distance-from-home value would be km.
Keep practising
6 worksheet questions · 13 marks
Read the questions online
- Using the journey log, give the distance from home at minute 7.2 marks
Journey log supplied for this example Time (min) Distance from home (km) 0 0 2 6 5 6 7 10 - How much farther from home is the traveller at minute 7 than at minute 5?2 marks
Journey log supplied for this example Time (min) Distance from home (km) 0 0 2 6 5 6 7 10 - For how long is the supplied journey graph flat?2 marks
- A graph has time in hours horizontally and distance in kilometres vertically. Explain .2 marks
- Use the cooling readings to find the total temperature fall in six minutes.2 marks
Supplied cooling readings Time (min) Temperature (°C) 0 80 2 65 4 55 6 50 - Plant height was recorded for four weeks. Why may continuing the same line to week 30 be unreliable?3 marks
Read the worked solutions
Equivalent correct methods earn the corresponding marks. Include units where asked.
- Using the journey log, give the distance from home at minute 7.2 marks
Journey log supplied for this example Time (min) Distance from home (km) 0 0 2 6 5 6 7 10 Read .
10 km. - How much farther from home is the traveller at minute 7 than at minute 5?2 marks
Journey log supplied for this example Time (min) Distance from home (km) 0 0 2 6 5 6 7 10 .
4 km. - For how long is the supplied journey graph flat?2 marks
It is flat from minute 2 to minute 5.
.
3 minutes. - A graph has time in hours horizontally and distance in kilometres vertically. Explain .2 marks
Use the horizontal label for the first coordinate.
After 2 hours the recorded/modelled distance is 90 km. - Use the cooling readings to find the total temperature fall in six minutes.2 marks
Supplied cooling readings Time (min) Temperature (°C) 0 80 2 65 4 55 6 50 .
30°C. - Plant height was recorded for four weeks. Why may continuing the same line to week 30 be unreliable?3 marks
The prediction assumes the same growth continues far beyond the observations.
Later growth may have a different rate, and the four-week data do not establish long-term behaviour.
Curriculum reference & lesson scope
Australian Curriculum v9.0 / South Australian Curriculum
Year 7 coordinate, pattern and authentic-graph interpretation scope. Includes prerequisite four-quadrant plotting; formal gradient/intercept techniques are not required here.
Official curriculum source ↗