
Understand the idea.
Make a table before drawing
Choose axes that show what the variables mean. Put the input horizontally and the output vertically, label both quantities, and include units. Read the numerical scale: equal distances along one axis must represent equal changes on that axis.
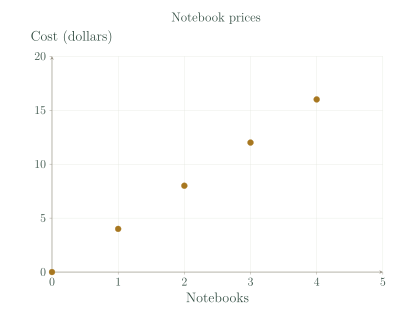
For notebooks costing dollars each, . Make a table before plotting, including . Whole notebooks allow only whole-number counts, so the model consists of separate cost points at those inputs.
| Notebooks n | Cost C (dollars) |
|---|---|
| 0 | 0 |
| 1 | 4 |
| 2 | 8 |
| 3 | 12 |
| 4 | 16 |
Connect the graph to the situation
Each plotted pair links two quantities. In a time-depth graph, means a time of minutes and a depth of centimetres. Read the axis labels before interpreting either number.
Join points only when intermediate inputs are meaningful and the model supports those values. The steady filling model allows times between whole minutes, with initial depth centimetres and increase centimetres per minute.
See the method in action.
Graph a counted quantity
Plot notebook cost for 0 to 4 notebooks.
Worked solution
- 1
Label the quantities and choose suitable scales.
Use notebook count n horizontally and cost C in dollars vertically; each notebook adds 4 dollars.
- 2
Calculate the allowed input-output pairs.
Substitute each whole-number count from 0 to 4 into the cost rule.
- 3
Plot the five separate points.
Whole notebooks are sold, so fractional counts between these points are not allowed.
Each extra notebook adds 4 dollars.
Read a continuous model
A depth model is , where t is minutes and d is centimetres. Explain (4,14).
Worked solution
- 1
Read the input from the ordered pair.
The first coordinate measures time on the horizontal axis.
- 2
Read the output from the ordered pair.
The second coordinate measures water depth on the vertical axis.
- 3
Check the pair against the model.
The rule confirms that after 4 minutes the depth is 14 cm.
After 4 minutes the water is 14 cm deep.
Try it yourself.
Check your understanding
For , where d is kilometres and C is dollars, explain (3,11).
Show answer & reasoning
A 3 km trip costs 11 dollars.
The pair records a distance input of kilometres and a cost output of dollars. The rule confirms , so a km trip costs dollars.
Keep practising
6 worksheet questions · 15 marks
Read the questions online
- For , find costs for 0,1,2,3 tickets.2 marks
- Plot the pairs for at .3 marks
- For , where is weeks and is cm, find the height at .2 marks
- For the same plant model, explain .2 marks
- A horizontal axis uses the same physical gap for 0 to 1 and for 1 to 5. Explain the error.3 marks
- A steady filling model gives depths 1,4,7,10 cm at times 0,1,2,3 min. Plot and join the points.3 marks
Read the worked solutions
Equivalent correct methods earn the corresponding marks. Include units where asked.
- For , find costs for 0,1,2,3 tickets.2 marks
Multiply each count by 3.
0,3,6,9 dollars. - Plot the pairs for at .3 marks
Label tickets on the horizontal axis and dollars vertically.
Only whole-ticket inputs are allowed.
,,,, as separate points.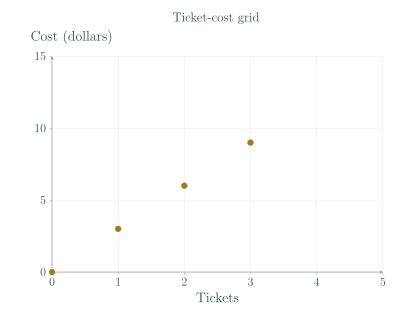
- For , where is weeks and is cm, find the height at .2 marks
.
10 cm. - For the same plant model, explain .2 marks
Read time first and height second.
At 2 weeks the model predicts 8 cm. - A horizontal axis uses the same physical gap for 0 to 1 and for 1 to 5. Explain the error.3 marks
The first gap represents 1 unit; the next represents 4 units.
An ordinary uniform scale needs equal numerical changes in equal physical gaps. - A steady filling model gives depths 1,4,7,10 cm at times 0,1,2,3 min. Plot and join the points.3 marks
The depth increases by 3 cm per minute.
Steady filling justifies intermediate depths.
,,,, joined by a straight segment.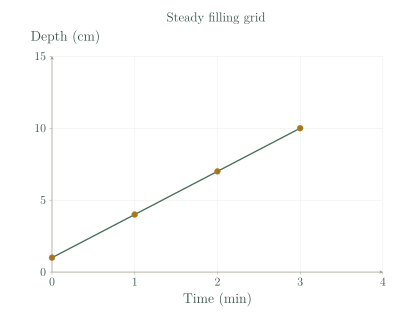
Curriculum reference & lesson scope
Australian Curriculum v9.0 / South Australian Curriculum
Year 7 coordinate, pattern and authentic-graph interpretation scope. Includes prerequisite four-quadrant plotting; formal gradient/intercept techniques are not required here.
Official curriculum source ↗