
Understand the idea.
Plan, collect and organise
Begin an investigation with a group, variable and common period. Here the fictional records concern books borrowed by twelve Year 7 students during one fortnight. Define what counts as a loan and apply that definition consistently to every student.
Check the records and organise repeated counts into a frequency table. Frequencies should total twelve. Keep names unnecessary to the question out of the report. Borrowing is the recorded variable; it does not establish how many books were read or finished.
| Books borrowed | Frequency |
|---|---|
| 4 | 1 |
| 5 | 2 |
| 6 | 3 |
| 7 | 2 |
| 8 | 2 |
| 9 | 1 |
| 13 | 1 |
Analyse, conclude and question
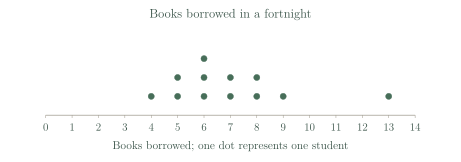
The loan records total books, giving mean , median , mode and range . A dot plot would show eleven counts from to and one higher count at . Use several features to describe the distribution.
Tie conclusions to these twelve records and this fortnight. A centre around six to eight loans describes this teaching dataset, but does not describe every Year 7 student. The small group and lack of a comparison also prevent claims that a program caused the pattern.
See the method in action.
Build a supported conclusion
Write a conclusion using two pieces of numerical evidence from the loan data.
| Books borrowed | Frequency |
|---|---|
| 4 | 1 |
| 5 | 2 |
| 6 | 3 |
| 7 | 2 |
| 8 | 2 |
| 9 | 1 |
| 13 | 1 |
Worked solution
- 1
Locate the two middle observations.
The cumulative frequencies put the sixth observation at six and the seventh at seven.
- 2
Calculate the median.
With twelve observations, the centre is the average of the two middle positions.
- 3
Find the modal count.
Six loans occurs more often than any other count, so the mode is six.
- 4
Write a conclusion supported by both measures.
For these twelve records during this fortnight, borrowing was centred around six to seven books: the median was six and a half, and the modal count was six.
For these twelve records, borrowing was centred around 6–7 books: the median was 6.5 and the modal count was 6.
Reject an unsupported causal claim
A report says, “The new library posters made all Year 7 students read seven books.” Explain problems with this claim.
Worked solution
- 1
Check what the records actually measure.
Loans do not establish that books were read or completed, so borrowing cannot be relabelled as reading.
- 2
Check the group covered by the evidence.
Twelve students’ records do not establish a result for every Year 7 student.
- 3
Check what the mean says about individuals.
Seven is an equal-share summary; the recorded individual loan counts differ.
- 4
Check whether a cause was tested.
No comparison or experiment isolates the effect of posters, so the records do not establish that posters caused the borrowing.
It confuses borrowing with reading, generalises beyond the records, treats a mean as every value and asserts an untested cause.
Try it yourself.
Check your understanding
The investigation records books borrowed. Can it conclude how many were finished?
Show answer & reasoning
No.
No. A loan record establishes that a book was borrowed. It contains no evidence that the borrower finished it, so completion would require a separate measure.
Keep practising
6 worksheet questions · 12 marks
Read the questions online
- Check the total frequency in the loans table.2 marks
Fictional teaching data: books borrowed in one fortnight Books borrowed Frequency 4 1 5 2 6 3 7 2 8 2 9 1 13 1 - Use the loans table to calculate the total number of loans.2 marks
Fictional teaching data: books borrowed in one fortnight Books borrowed Frequency 4 1 5 2 6 3 7 2 8 2 9 1 13 1 - Find the mean loans per student.2 marks
Fictional teaching data: books borrowed in one fortnight Books borrowed Frequency 4 1 5 2 6 3 7 2 8 2 9 1 13 1 - Why can the median be 6.5 books when counts are whole numbers?2 marks
Fictional teaching data: books borrowed in one fortnight Books borrowed Frequency 4 1 5 2 6 3 7 2 8 2 9 1 13 1 - The record of 13 loans is confirmed correct. Should it be removed because it is higher than the others? Explain.2 marks
- Suggest an improvement if the question becomes “How much do students across the whole year borrow during a term?”2 marks
Read the worked solutions
Equivalent correct methods earn the corresponding marks. Include units where asked.
- Check the total frequency in the loans table.2 marks
Fictional teaching data: books borrowed in one fortnight Books borrowed Frequency 4 1 5 2 6 3 7 2 8 2 9 1 13 1 .
12 students. - Use the loans table to calculate the total number of loans.2 marks
Fictional teaching data: books borrowed in one fortnight Books borrowed Frequency 4 1 5 2 6 3 7 2 8 2 9 1 13 1 .
84 books. - Find the mean loans per student.2 marks
Fictional teaching data: books borrowed in one fortnight Books borrowed Frequency 4 1 5 2 6 3 7 2 8 2 9 1 13 1 .
7 books. - Why can the median be 6.5 books when counts are whole numbers?2 marks
Fictional teaching data: books borrowed in one fortnight Books borrowed Frequency 4 1 5 2 6 3 7 2 8 2 9 1 13 1 .
A summary need not be an observed count.
For 12 observations, the median is the average of the sixth and seventh values, 6 and 7. - The record of 13 loans is confirmed correct. Should it be removed because it is higher than the others? Explain.2 marks
It is a genuine observation belonging to the question.
Keep it and describe its influence.
No. - Suggest an improvement if the question becomes “How much do students across the whole year borrow during a term?”2 marks
Match the collection period and group to the new question.
A fortnight and twelve selected students do not establish the broader pattern.
Use the whole term and a suitably selected larger group across the year, with the same loan definition.
Curriculum reference & lesson scope
Australian Curriculum v9 / South Australian Mathematics Curriculum
Year 7 statistical variables, representations, summary statistics, outliers and an original small investigation; deeper sampling methods develop in Year 8.
Official curriculum source ↗