
Understand the idea.
Fixed parameter, varying intervals
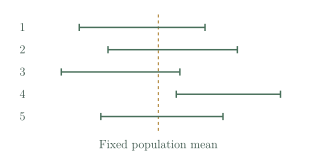
In repeated sampling, the population parameter stays fixed while the data and interval endpoints change. A valid 95% confidence procedure produces intervals containing that parameter in about 95% of repetitions. This coverage statement depends on the sampling and model assumptions.
Once an interval has been observed, it either contains the fixed parameter or misses it. We may not know which. Saying we are 95% confident refers to the reliability of the procedure, rather than a calculated probability distribution for that fixed parameter.
Do not answer a different question
Name the parameter before interpreting the bounds. An interval for the population mean estimates an average, not a range containing 95% of individuals. Nor does its confidence level specify the percentage of future sample means inside those particular observed bounds.
For the same data and interval model, demanding higher confidence increases the critical value and widens the interval. This trades precision for coverage. Neither a high confidence level nor a narrow interval repairs biased selection or inaccurate measurements.
See the method in action.
A defensible interpretation
Interpret a 95% mean travel-time interval (48,52) minutes.
Worked solution
- 1
Identify what the interval estimates.
The task concerns a population average, rather than individual travel times.
- 2
Attach confidence and units to the bounds.
We are 95% confident that the population mean travel time lies between 48 and 52 minutes, under the study assumptions.
- 3
Explain the repeated-sampling meaning.
If the study were repeated using the same valid procedure, about 95% of its intervals would contain the fixed population mean.
- 4
Keep individuals separate from the mean.
The interval does not claim that 95% of individual trips take between 48 and 52 minutes.
We are 95% confident the population mean is between 48 and 52 minutes, under the study assumptions.
Expected coverage
A correct 90% interval method is repeated independently 200 times. How many captures are expected?
Worked solution
- 1
Represent the capture count.
Under the stated correct method and independent repetitions, each interval captures the parameter with probability 0.90.
- 2
Calculate its expectation.
A binomial count has expectation equal to the number of trials times the success probability.
- 3
Interpret the expected number.
180 is the expected capture count; random variation means the realised count need not be exactly 180.
180; the realised count need not be exactly 180.
Try it yourself.
Check your understanding
Is a 99% interval narrower than a 95% interval from identical data?
Show answer & reasoning
No, it is wider.
No. Holding the data and model fixed, the normal critical value rises from about at 95% to at 99%. Since the standard error stays the same, the 99% interval is wider.
Keep practising
6 worksheet questions · 12 marks
Read the questions online
- Correct: “95% of residents have support rates between 0.52 and 0.60.”2 marks
- A 95% procedure is used 400 times independently. Find expected misses.2 marks
- Why can the realised count of misses differ from its expected count?2 marks
- Can a correctly calculated 95% interval miss the true mean?2 marks
- Explain the precision trade-off when confidence rises from 90% to 99%.2 marks
- Why is a confidence interval for a mean not a prediction interval for one new measurement?2 marks
Read the worked solutions
Equivalent correct methods earn the corresponding marks. Include units where asked.
- Correct: “95% of residents have support rates between 0.52 and 0.60.”2 marks
A population proportion is one aggregate parameter, not a personal support rate.
We are 95% confident that the population support proportion is between 0.52 and 0.60. - A 95% procedure is used 400 times independently. Find expected misses.2 marks
.
. - Why can the realised count of misses differ from its expected count?2 marks
An expectation is an average over repetitions.
Repeated sample outcomes vary randomly. - Can a correctly calculated 95% interval miss the true mean?2 marks
The procedure misses in about 5% of repetitions under its model.
Yes. - Explain the precision trade-off when confidence rises from 90% to 99%.2 marks
The standard error stays fixed while the critical value increases.
The wider interval is less precise but has greater long-run coverage. - Why is a confidence interval for a mean not a prediction interval for one new measurement?2 marks
Mean uncertainty uses standard error, not the full individual spread.
Individual measurements vary more than sample means and need a different uncertainty model.
Curriculum reference & lesson scope
SACE Board of South Australia
Stage 2 Mathematical Methods: sampling distributions and confidence intervals for means and proportions. Mean tasks distinguish known population spread from sufficiently large-sample estimated-spread normal intervals. Repeated-interval computational simulation, approximation conditions, design and interpretation are included.
Official curriculum source ↗