
Understand the idea.
A bell-shaped family
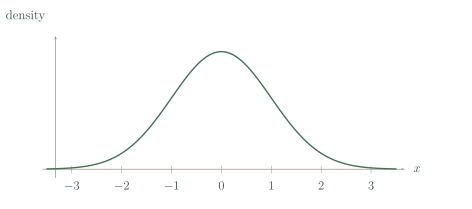
A normal distribution is symmetric and bell-shaped, with mean, median and mode at the same centre. Standard deviation controls spread: increasing it widens and lowers the curve while total area stays . The theoretical support is all real numbers.
Here lists the mean and variance. A calculator may instead request standard deviation . Check its input label. For a nonnegative measurement, a substantial predicted negative tail can indicate that a normal model is unsuitable.
Use symmetry and sensible approximations
Symmetry places half the probability on each side of the mean. The empirical rule estimates about , and within one, two and three standard deviations. These are quick checks on a calculated area.
Use a normal cumulative calculation when greater precision is needed, and sketch the intended interval first. Distinguish an individual measurement from a sample mean: independent averaging reduces the spread, so the same bounds can give very different probabilities.
See the method in action.
Read the parameters
. State its mean, standard deviation and P(X>64).
Worked solution
- 1
Read the mean and variance in the stated convention.
The second parameter is variance in the notation used here.
- 2
Take the square root of the variance.
Standard deviation is the positive scale parameter.
- 3
Use normal symmetry at the mean.
Half the continuous distribution lies strictly above its centre.
64; 5; 0.5.
Estimate a central region
A normal variable has mean 100 and standard deviation 8. Estimate P(84<X<116).
Worked solution
- 1
Express both bounds in standard-deviation units.
The requested interval extends two standard deviations on either side of the mean.
- 2
Apply the empirical rule.
About 95% of a normal distribution lies within two standard deviations.
- 3
Distinguish the estimate from the calculated area.
The more precise normal area is about 95.45%, consistent with the requested estimate of about 95%.
About 95%.
Try it yourself.
Check your understanding
. Find its standard deviation and median.
Show answer & reasoning
4 and 50.
The standard deviation is . Normal symmetry makes the median equal the mean, so the median is .
Keep practising
6 worksheet questions · 12 marks
Read the questions online
- . State mean and standard deviation.2 marks
- A normal model has mean 40 and standard deviation 6. Give the central two-SD interval.2 marks
- Why is the probability at exactly the normal mean not 0.5?2 marks
- Does doubling the standard deviation change the total density area?2 marks
- A waiting-time distribution has a very long right tail. Is a symmetric normal model automatically suitable?2 marks
- . Estimate using the empirical rule.2 marks
Read the worked solutions
Equivalent correct methods earn the corresponding marks. Include units where asked.
- . State mean and standard deviation.2 marks
The parameters are mean and variance.
12 and 3. - A normal model has mean 40 and standard deviation 6. Give the central two-SD interval.2 marks
.
. - Why is the probability at exactly the normal mean not 0.5?2 marks
A half-line has probability 0.5; one point has no area.
A singleton has probability zero. - Does doubling the standard deviation change the total density area?2 marks
The curve widens and lowers.
No; it stays one. - A waiting-time distribution has a very long right tail. Is a symmetric normal model automatically suitable?2 marks
The shape is inconsistent with a normal model; inspect actual behaviour.
No. - . Estimate using the empirical rule.2 marks
The endpoints are one standard deviation from the mean.
About 0.68.
Curriculum reference & lesson scope
SACE Board of South Australia
Stage 2 Mathematical Methods: continuous random variables, normal distributions and sampling distributions of sample means. Original lessons and practice.
Official curriculum source ↗