
Understand the idea.
A number attached to an outcome
A random variable assigns a number to each outcome. Define exactly what is counted and over what period. A discrete variable has a listable set of possible values, such as the number of heads in two tosses: .
Different outcomes may give the same value. The outcomes HT and TH both give , so their probabilities must be combined. A list of values alone does not tell you how likely each value is.
A complete table carries all the probability
A probability table must account for every possible value without counting any outcome twice. Each probability lies between and , and the probabilities sum to . Check both conditions; a correct total cannot repair a negative entry.
For a discrete bar chart, read each probability from its bar height. The gaps between possible values carry no probability. This will differ from a continuous density, where area rather than height represents probability.
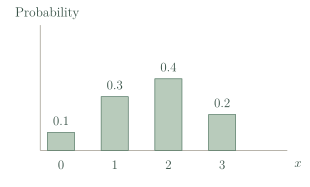
See the method in action.
Two tosses, three values
Two independent fair coins are tossed. Let X be the number of heads. Construct its distribution.
Worked solution
- 1
List the equally likely outcomes.
Fairness and independence make each ordered pair have probability one quarter.
- 2
Group the outcomes by head count.
The middle value combines two different outcomes.
- 3
Check the complete distribution.
The three counts cover every outcome and all probabilities are nonnegative.
Find a normalising constant
X has values 1, 2 and 3 with probabilities . Find k and P(X = 3).
Worked solution
- 1
Set the total probability to one.
The listed values are mutually exclusive and exhaustive.
- 2
Solve and check the probabilities.
The resulting probabilities are , all within .
- 3
Select the probability at three.
Use the entry associated with the required value, rather than the value itself.
Try it yourself.
Check your understanding
A probability table has entries 0.15, 0.45 and p. Find p.
Show answer & reasoning
p = 0.40.
The entries must total , so . This is also a valid nonnegative probability.
Keep practising
6 worksheet questions · 13 marks
Read the questions online
- Let count the number of goals in a match. Explain why is discrete.1 mark
- takes values 0, 2 and 5 with probabilities 0.2, 0.5 and . Find .2 marks
- For values −1, 0 and 1, probabilities are . Find and the probability of a positive value.3 marks
- A proposed table uses probabilities 0.4, −0.1 and 0.7. Is it valid? Explain.2 marks
- A bag contains three red and one blue counter. One is selected fairly. Define for red and for blue. Give its distribution.2 marks
- Two fair independent coin tosses are made. Let be the number of tails. Give all values and probabilities.3 marks
Read the worked solutions
Equivalent correct methods earn the corresponding marks. Include units where asked.
- Let count the number of goals in a match. Explain why is discrete.1 mark
Goals are counted in whole numbers.
The possible values can be listed.
Its possible values are 0, 1, 2, … . - takes values 0, 2 and 5 with probabilities 0.2, 0.5 and . Find .2 marks
Add the known probabilities: .
Use total probability 1: .
. - For values −1, 0 and 1, probabilities are . Find and the probability of a positive value.3 marks
, so .
Only the value 1 is positive, giving probability .
. - A proposed table uses probabilities 0.4, −0.1 and 0.7. Is it valid? Explain.2 marks
The entries do sum to 1.
That is insufficient: every individual probability must be at least zero.
No. A probability is negative. - A bag contains three red and one blue counter. One is selected fairly. Define for red and for blue. Give its distribution.2 marks
There are four equally likely counters.
Group the three red outcomes at and the one blue outcome at .
. - Two fair independent coin tosses are made. Let be the number of tails. Give all values and probabilities.3 marks
List HH, HT, TH and TT.
The tail counts are 0, 1, 1 and 2; group equal counts.
with probabilities .
Curriculum reference & lesson scope
SACE Board of South Australia
Stage 2 Mathematical Methods: discrete random variables and probability distributions, expected value and variance, transformations and independent sums, Bernoulli and binomial models. Original supporting lessons and exercises follow the approved Ascent chapter structure.
Official curriculum source ↗