
Understand the method.
The line predicts from and passes through the point of sample means .
Measure vertical prediction errors
A residual is the observed response minus the predicted response at the same . It is a vertical difference on the scatter plot.
Least squares chooses the slope and intercept that minimise the sum of squared residuals. Squaring prevents positive and negative errors cancelling.
Calculate slope first, then intercept
Use centred sums, or correlation and standard deviations, to find the slope. Then substitute the two sample means to find the intercept.
Keep unrounded coefficients for calculations. Round the final prediction to a precision that suits the measurements.
Check what the model can predict
Name the response, the explanatory variable and their units. Record the observed -range before making predictions.
Inspect the scatter plot: a calculated line is not automatically a sensible model. Curvature, clusters or influential outliers may need attention.
See the method in action.
Calculate a fitted line
Fit on to the supplied table.
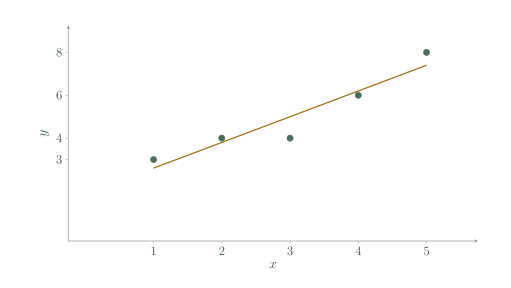
| x | y |
|---|---|
| 1 | 3 |
| 2 | 4 |
| 3 | 4 |
| 4 | 6 |
| 5 | 8 |
Worked solution
- 1
Calculate the sample means.
Use all five paired rows from the supplied table.
- 2
Calculate the centred sums and slope.
Multiply matching deviations for ; square the -deviations for .
- 3
Find the intercept and state the model.
At , the predicted response is , so the line passes through the point of means.
. The observed input range is .
Fit from summary statistics
For , , , and , find the regression line.
Worked solution
- 1
Use correlation and the two standard deviations.
The response standard deviation goes in the numerator because the model predicts from .
- 2
Substitute the means to find the intercept.
A fitted line with an intercept passes through .
- 3
Write the prediction equation.
The hat distinguishes a predicted response from an observed one.
.
Try it yourself.
Calculate, explain, then apply.
Use the point of means
Given , and slope , find the intercept.
Show answer & reasoning
.
Use .
Keep practising
6 worksheet questions · 18 marks
Read the questions online
- Find the line from and .3 marks
- Given and , find the regression line.3 marks
- A candidate line has residuals ,1,1. Calculate its sum of squared residuals.3 marks
- Two models have residuals and . Which has the smaller least-squares error?3 marks
- A regression line has and . Predict at .3 marks
- A student rounds to 0.1 before predicting at . Explain the risk.3 marks
Read the worked solutions
Equivalent correct methods earn the corresponding marks. Include units where asked.
- Find the line from and .3 marks
.
.
. - Given and , find the regression line.3 marks
.
.
. - A candidate line has residuals ,1,1. Calculate its sum of squared residuals.3 marks
Square each residual: 4,1,1.
Add the squares, not their signed values.
6. - Two models have residuals and . Which has the smaller least-squares error?3 marks
A has squared sum .
B has , so B is better on this criterion.
B. - A regression line has and . Predict at .3 marks
Substitute into .
.
13. - A student rounds to 0.1 before predicting at . Explain the risk.3 marks
A small coefficient rounding can become large after multiplication by .
Keep guard digits until the final prediction.
The slope contribution changes from 76.257 to 90, an error of 13.743.
Curriculum reference & lesson scope
SACE Board of South Australia
Stage 2 General Mathematics: statistical models. Original lessons and assessment practice; not an official SACE assessment.
Official curriculum source ↗