
Understand the idea.
Describe three different features
Direction describes whether the response tends to rise or fall as the explanatory variable increases. Form describes the shape, such as linear or curved. Strength describes how tightly observations follow that shape; assess these three features separately.
A steep pattern can have large scatter, while a gentle pattern can be very tight. Changing centimetres to metres changes the numerical slope and appearance of the axes, but does not change how consistently the measurements are related.
A curved relationship can still be strong
A U-shaped pattern can be strong even though it has no single increasing or decreasing direction over the whole range. Pearson's measures linear association, so a value near zero may conceal a clear curve. Inspect the scatter plot first.
Describe groups and unusual points as well as the main tendency. Use “approximately linear” when the dots scatter around a straight pattern. An exact relationship among the observed pairs does not establish that every future observation must follow it.
See the method in action.
Negative and linear
Describe the pattern in the supplied distances and remaining fuel.
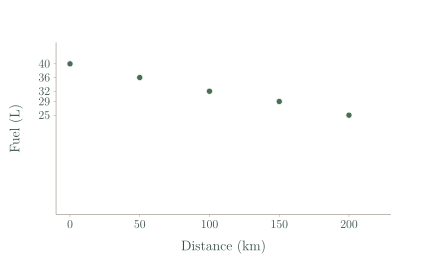
| Distance (km) | Fuel remaining (L) |
|---|---|
| 0 | 40 |
| 50 | 36 |
| 100 | 32 |
| 150 | 29 |
| 200 | 25 |
Worked solution
- 1
Read the overall direction.
Larger distances correspond to less remaining fuel, so the association is negative.
- 2
Compare changes over equal distance intervals.
The fuel changes are similar for successive 50 km increases, supporting an approximately straight pattern.
- 3
Judge the scatter around that pattern.
The points lie close to a descending line, giving a strong negative, approximately linear association.
Strong negative, approximately linear association.
Strong but not linear
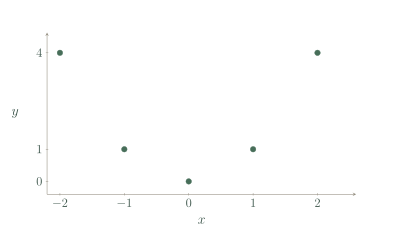
Describe the pairs (-2,4), (-1,1), (0,0), (1,1), (2,4).
Worked solution
- 1
Check a possible curved rule against the supplied pairs.
Every supplied response equals the square of its paired explanatory value.
- 2
Describe the form and direction.
The responses fall to zero and then rise, forming a U rather than a straight line or one overall positive or negative direction.
- 3
State the strength for these observations.
All five observed points lie exactly on the curve, so the observed association is strong and nonlinear.
Strong nonlinear U-shaped association.
Try it yourself.
Check your understanding
Points lie very close to a downward-sloping line. Describe direction, form and strength.
Show answer & reasoning
Strong negative linear association.
The downward direction is negative, the straight form is linear, and the close clustering makes the association strong. All three features are needed in the description.
Keep practising
6 worksheet questions · 18 marks
Read the questions online
- Describe direction, form and strength for .3 marks
Paired measurements 1 10 2 8 3 6 4 4 - Describe the supplied pairs .3 marks
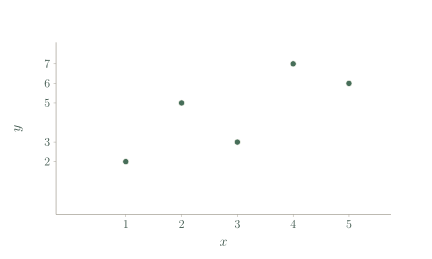
- A scatter plot rises sharply but its points are widely scattered. Is “strong because it is steep” valid?3 marks
- What form is suggested by ?3 marks
Paired measurements 0 1 1 2 2 4 3 8 - The U-shaped data have . Is there no relationship?3 marks
- Two graphs show the same data but use centimetres and metres on the vertical axes. Should their correlation strengths differ?3 marks
Read the worked solutions
Equivalent correct methods earn the corresponding marks. Include units where asked.
- Describe direction, form and strength for .3 marks
Paired measurements 1 10 2 8 3 6 4 4 Each one-unit rise in reduces by 2.
All points lie exactly on .
Perfect negative linear association. - Describe the supplied pairs .3 marks
The overall response increases as increases.
It is not exact and no strong curvature is evident.
Positive, roughly linear association with visible scatter. - A scatter plot rises sharply but its points are widely scattered. Is “strong because it is steep” valid?3 marks
Slope and strength describe different features.
Assess closeness to the trend, not just steepness.
No. Wide scatter can indicate weak linear association despite a steep trend. - What form is suggested by ?3 marks
Paired measurements 0 1 1 2 2 4 3 8 Successive -values double.
The increase is not constant, so a straight line is not the natural form.
Positive nonlinear, exponential-looking association. - The U-shaped data have . Is there no relationship?3 marks
The increasing and decreasing sections balance the linear correlation.
Inspect the graph; only summarises a straight-line tendency.
No. There is a strong nonlinear relationship . - Two graphs show the same data but use centimetres and metres on the vertical axes. Should their correlation strengths differ?3 marks
Every vertical value is multiplied by the same positive constant.
The display’s apparent steepness can change while stays the same.
No. A positive unit conversion does not change the association strength.
Curriculum reference & lesson scope
SACE Board of South Australia
Stage 2 General Mathematics: statistical models. Original lessons and assessment practice; not an official SACE assessment.
Official curriculum source ↗