
Understand the idea.
Turn the wording into an area
Identify the shaded region before using a normal calculator. Write the desired lower tail, upper tail or interval, and standardise its boundaries using . With , an upper tail is and an interval is the difference of two cumulative areas.
Check that the result lies between zero and one and suits the region's size. For measurements each having event probability , the expected event count is . Mean and standard deviation alone do not determine normal probabilities without a normal-model assumption.
Inverse normal means work from area to value
An inverse normal calculation starts with an area and finds its boundary. Convert the wording to a lower-tail proportion , calculate , then return to original units using . The highest 10% starts above the mean at lower-tail area .
Retain guard digits until the final cutoff and round to sensible measurement units. Check the side of the mean: an upper percentile should give a positive standardised value. In a continuous normal model, including an interval endpoint does not change its probability.
See the method in action.
Between two masses
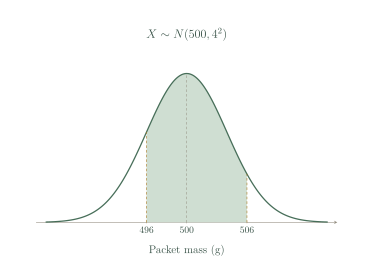
Mass X has mean 500 g and SD 4 g. Find P(496<X<506).
Worked solution
- 1
State the distribution assumption for the calculation.
Use the normal-model assumption of this lesson. A mean and standard deviation alone would not determine the requested interval probability.
- 2
Standardise both mass limits.
The lower limit is one standard deviation below the mean and the upper is one and a half above it.
- 3
Subtract the cumulative areas.
Subtracting the area below the lower boundary from that below the upper leaves only the interval between them.
- 4
Interpret the probability.
Under the normal model, about 77.45% of packet masses fall between 496 g and 506 g.
0.7745.
An upper cutoff
Scores are normal with mean 70 and SD 8. Find the cutoff for the highest 10%.
Worked solution
- 1
Convert the upper-tail wording to a lower-tail area.
The cutoff for the highest 10% leaves 90% of the continuous distribution below it.
- 2
Find the standard normal boundary.
The positive z-value is consistent with a cutoff above the mean.
- 3
Convert the boundary to score units.
Using the unrounded inverse-normal value gives the stated cutoff of approximately 80.25, with about 10% of modelled scores above it.
Approximately 80.25.
Try it yourself.
Check your understanding
For X normal with mean 20 and SD 2, find the median.
Show answer & reasoning
20.
The median splits the probability into equal halves. A normal distribution is symmetric about its mean, so its median is the mean, , regardless of the standard deviation.
Keep practising
6 worksheet questions · 18 marks
Read the questions online
- For standard normal, calculate .3 marks
- For standard normal, calculate .3 marks
- For with mean 50 and SD 6, find .3 marks
- For with mean 100 and SD 12, find the 25th percentile.3 marks
- A normal quality model gives . Out of 250 items, find the expected number passing.3 marks
- Find the upper 5% cutoff for a normal variable with mean 40 and SD 3.3 marks
Read the worked solutions
Equivalent correct methods earn the corresponding marks. Include units where asked.
- For standard normal, calculate .3 marks
Use the standard normal lower-tail function at 1.2.
0.8849. - For standard normal, calculate .3 marks
Use .
0.1151. - For with mean 50 and SD 6, find .3 marks
The -limits are and 2.
Subtract from .
0.8186. - For with mean 100 and SD 12, find the 25th percentile.3 marks
Use .
Calculate .
91.91. - A normal quality model gives . Out of 250 items, find the expected number passing.3 marks
.
This is an expectation, not a guaranteed realised count.
235. - Find the upper 5% cutoff for a normal variable with mean 40 and SD 3.3 marks
Top 5% means lower-tail area 0.95.
Calculate .
44.93.
Curriculum reference & lesson scope
SACE Board of South Australia
Stage 2 General Mathematics: statistical models. Original lessons and assessment practice; not an official SACE assessment.
Official curriculum source ↗