
Understand the idea.
One individual, two numerical measurements
A paired observation contains two numerical measurements from the same individual. For a student, practice time and quiz score belong in one row. Keep that row together: swapping scores between students changes the relationship being studied.
In a scatter plot, one observation gives one point. Identical pairs occupy the same location, so overlapping dots may hide repeated observations. Count the table rows when you need the number of individuals.
Build a graph that can be read
Choose the horizontal variable to suit the prediction question, usually the explanatory variable. Put the response vertically. Label both axes with names and units, and use evenly spaced values on each numerical scale; the two scales need not match.
Read each row as and check its coordinates against the table. Leave separate observations as separate dots. Joining them in row order creates a path that the measurements do not describe.
See the method in action.
Plot paired scores
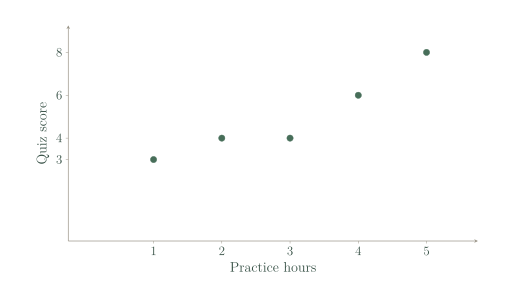
The table records practice hours and quiz scores. Describe how to plot it.
| Practice hours | Quiz score |
|---|---|
| 1 | 3 |
| 2 | 4 |
| 3 | 4 |
| 4 | 6 |
| 5 | 8 |
Worked solution
- 1
Assign the axes.
Practice time is the explanatory measurement; quiz score is the response being compared with it.
- 2
Read each row as an ordered pair.
The horizontal coordinate is hours and the vertical coordinate is the score from the same student.
- 3
Plot the five locations on labelled, evenly spaced scales.
All five pairs are distinct, so each has its own dot. Do not join the dots; their overall upward pattern is an association between measurements.
Five points at (1,3), (2,4), (3,4), (4,6), (5,8).
Keep identities together
Two plants have (height, leaves) measurements (12,8) and (20,5). Someone sorts both columns from small to large and plots (12,5), (20,8). Explain the error.
Worked solution
- 1
Recover the original pair for each plant.
The leaf count must remain attached to the height of the plant on which it was measured.
- 2
Identify the effect of sorting the columns separately.
These new pairs assign the first plant the second plant's leaves, and vice versa; they are not the recorded observations.
- 3
Restore the original rows before plotting.
Sorting complete rows is permissible, but sorting one measurement independently destroys the pairing.
The correct points are (12,8) and (20,5).
Try it yourself.
Check your understanding
A table row says distance 6 km and travel time 18 min. With distance on the horizontal axis, which point is plotted?
Show answer & reasoning
(6,18)
Distance is horizontal, so the first coordinate is . Travel time is vertical, so the second is : plot , with kilometres and minutes shown on the axes.
Keep practising
6 worksheet questions · 18 marks
Read the questions online
- For the supplied practice-hours table, write all five ordered pairs.3 marks
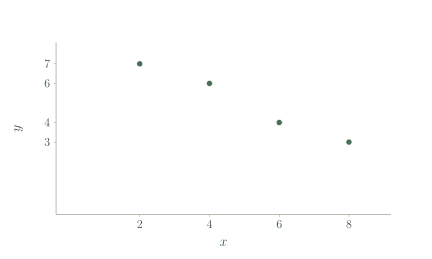
Paired measurements Practice hours Quiz score 1 3 2 4 3 4 4 6 5 8 - The supplied scatter plot represents . Check the point for and state the overall direction.3 marks
- Five measurements are . Why may only four dots be visible?3 marks
- You want to study whether bicycle mass is related to stopping distance. Name two numerical measurements to collect for each bicycle and state units.3 marks
- For a survey of favourite colour and height, is an ordinary numerical scatter plot suitable? Explain.3 marks
- A graph has axes called and but no units. Give two improvements before presenting it to readers.3 marks
Read the worked solutions
Equivalent correct methods earn the corresponding marks. Include units where asked.
- For the supplied practice-hours table, write all five ordered pairs.3 marks
Paired measurements Practice hours Quiz score 1 3 2 4 3 4 4 6 5 8 Read each row across without reordering either column.
. - The supplied scatter plot represents . Check the point for and state the overall direction.3 marks
Read the response at .
The points fall overall as increases.
The point is ; negative association. - Five measurements are . Why may only four dots be visible?3 marks
Count observations separately from distinct locations.
Two individuals have identical coordinates.
The repeated pair overlaps. - You want to study whether bicycle mass is related to stopping distance. Name two numerical measurements to collect for each bicycle and state units.3 marks
Keep the same bicycle’s two values in the same row.
Use a controlled braking procedure so distances are comparable.
For each bicycle: mass in kg and stopping distance in m. - For a survey of favourite colour and height, is an ordinary numerical scatter plot suitable? Explain.3 marks
A scatter plot requires two numerical variables.
Height can instead be compared across colour groups using a suitable grouped display.
No. Favourite colour is categorical, not a numerical coordinate. - A graph has axes called and but no units. Give two improvements before presenting it to readers.3 marks
Readers must know what each position measures.
Numerical scales must be evenly spaced and cover the observations.
Use descriptive variable names and units; use clear numerical tick scales.
Curriculum reference & lesson scope
SACE Board of South Australia
Stage 2 General Mathematics: statistical models. Original lessons and assessment practice; not an official SACE assessment.
Official curriculum source ↗