
Understand the idea.
Distinguish an outlier from an influential point
An unusual response can produce a large residual, while an unusual -value places a point far along the predictor axis. A point is influential if including it substantially changes the fitted model. Residual size alone does not measure influence.
Check the original record, units and pairing before deciding how to treat an unusual point. A verified transcription error can be corrected. A genuine unusual observation may reveal a separate condition or an important limitation of the model.
Compare, explain and retain an audit trail
Use a sensitivity analysis: compare fits with and without the questioned point, including slope, intercept, and relevant predictions. This measures its effect; it does not, by itself, provide a reason to exclude the point.
Base corrections or exclusions on documented validity and population criteria. Retain a record of what changed and why. If the point is genuine and its cause uncertain, report the sensitivity openly instead of deleting it to obtain a larger correlation.
See the method in action.
Measure an effect
Fit the supplied five points, then compare with the first four.
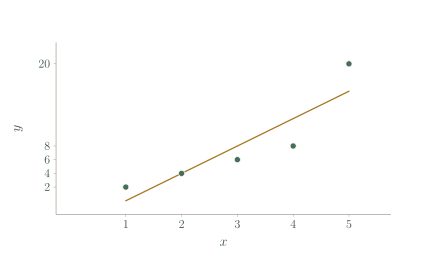
| x | y |
|---|---|
| 1 | 2 |
| 2 | 4 |
| 3 | 6 |
| 4 | 8 |
| 5 | 20 |
Worked solution
- 1
Calculate the means using all five points.
The fifth point contributes to both the mean and the fitted line.
- 2
Calculate the all-data centred sums.
The cross-products pair each predictor deviation with its own response deviation.
- 3
Fit the line to all five observations.
The least-squares slope is the cross-product sum divided by the predictor sum of squares.
- 4
Fit the first four observations.
These four points lie exactly on this line, whose squared residual sum is zero, so it is their least-squares fit.
- 5
Compare the slopes and investigate.
The final point doubles the slope and is influential for this fit. Its effect warrants investigation, not automatic removal.
All-data slope 4 versus 2 without the final point.
Correct a verified error
A table records a 170 cm person as 1700 cm. The original measurement sheet confirms 170 cm. What should the analyst do?
Worked solution
- 1
Compare the table entry with the verified source.
The original measurement sheet confirms the recorded table value is a transcription error.
- 2
Correct the entry and document the evidence.
Use the verified measurement for the same person and preserve a record of the original entry, correction and source.
- 3
Refit with the corrected paired data.
The erroneous value may have changed the model. Recalculate the fit; this corrects a known error rather than excluding a genuine inconvenient observation.
Correct the verified entry, preserve the record of the change, and refit.
Try it yourself.
Check your understanding
A valid point is unusual but its cause is unknown. What is a responsible report?
Show answer & reasoning
Show the fit’s sensitivity with and without it, explain the uncertainty, and avoid silently deleting it.
Show how the fit and predictions change with and without the valid point, and explain that its cause remains unknown. A desired correlation is not a justified basis for silently deleting evidence.
Keep practising
6 worksheet questions · 18 marks
Read the questions online
- For , calculate the fitted slope using all observations and compare with the first four.3 marks
Paired measurements 1 2 2 4 3 6 4 8 5 20 - An unusually high score is confirmed as correct. Is this alone a reason to delete it?3 marks
- An isolated point has a very large -value but lies close to a regression line. Could it be influential?3 marks
- Two reports use the same data, but one silently omits three low outcomes. State the problem.3 marks
- An all-data model predicts 40 and the model without one point predicts 55 for the same . What does this show?3 marks
- Suggest a justified reason to exclude a correctly recorded point from a particular analysis.3 marks
Read the worked solutions
Equivalent correct methods earn the corresponding marks. Include units where asked.
- For , calculate the fitted slope using all observations and compare with the first four.3 marks
Paired measurements 1 2 2 4 3 6 4 8 5 20 For all five, gives the fitted slope.
The first four are exactly .
All-data slope 4; first-four slope 2. - An unusually high score is confirmed as correct. Is this alone a reason to delete it?3 marks
Investigate whether it belongs to the target population.
Report justified sensitivity rather than silently improving the fit.
No. A genuine score should not be excluded merely because it is unusual. - An isolated point has a very large -value but lies close to a regression line. Could it be influential?3 marks
Influence is about changing the fit, not just distance vertically from it.
Yes. Its extreme predictor location can strongly affect the slope even with a small residual. - Two reports use the same data, but one silently omits three low outcomes. State the problem.3 marks
A report must disclose exclusions and give a defensible criterion.
Selective omission can bias the model and mislead readers. - An all-data model predicts 40 and the model without one point predicts 55 for the same . What does this show?3 marks
The difference is 15 response units.
Do not hide the sensitivity behind a single prediction.
The prediction is sensitive to that observation; further investigation and both results should be reported. - Suggest a justified reason to exclude a correctly recorded point from a particular analysis.3 marks
The population criterion should be scientifically relevant and disclosed, not chosen to maximise correlation.
It may be from outside the explicitly defined target population, such as a different machine type.
Curriculum reference & lesson scope
SACE Board of South Australia
Stage 2 General Mathematics: statistical models. Original lessons and assessment practice; not an official SACE assessment.
Official curriculum source ↗