
Understand the idea.
Choose for the job
Choose a display by asking what the reader needs to do. A table lets someone look up an exact value. A column graph compares counts in separate categories. A line graph follows a measurement through ordered times.
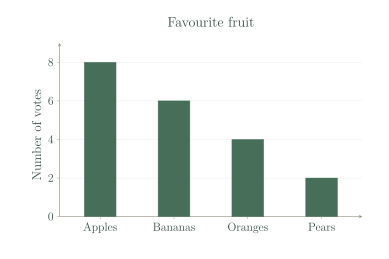
Favourite fruits belong in separate categories. Use one equal-width column per fruit, with equal gaps. Joining their tops would suggest a connection between neighbouring fruits, whereas apples and bananas are choices rather than successive times.
A fair graph
A reader should be able to tell what was counted or measured. Add a clear title, category labels and a number-axis label with units when needed. For these column graphs, begin the count scale at zero so heights show the counts fairly.
Equal distances on a number axis must represent equal increases. A scale marked increases by two at each step, so a column reaching represents six votes, not three. A picture graph also needs a clear key.
See the method in action.
Compare choices
Which display makes the favourite-fruit counts easy to compare?
| Fruit | Votes |
|---|---|
| Apples | 8 |
| Bananas | 6 |
| Oranges | 4 |
| Pears | 2 |
Worked solution
- 1
Identify what the fruit data describe.
Apples, bananas, oranges and pears are separate choices, and the table records a count for each choice.
- 2
Choose a column graph.
Separate columns let the reader compare the four counts directly by their heights.
- 3
Set the columns against a labelled, even count scale.
A Votes axis beginning at zero with equal steps gives each count the same visual scale.
A column graph.
Look up an exact value
A coach needs each runner's finishing time to the nearest second. Would a table help?
Worked solution
- 1
Identify the coach's need for exact times.
The question asks for each runner's recorded time to the nearest second, rather than just an overall pattern.
- 2
Pair each runner code with a time in a table.
A row keeps the correct runner and finishing time together, and a seconds heading identifies the unit.
- 3
Use the table to look up the recorded values.
A table shows each time directly without requiring the coach to estimate a point's position on a graph.
Yes. Use a table with runner codes and times in seconds.
Try it yourself.
Check your understanding
Choose a column graph or line graph to compare numbers of red, blue and green counters.
Show answer & reasoning
A column graph.
Use a column graph because red, blue and green are separate colour categories. Each column shows a count, allowing the three counts to be compared without suggesting a sequence through time.
Keep practising
6 worksheet questions · 9 marks
Read the questions online
- Choose a display for the number of pupils choosing each of four sports.1 mark
- Choose a display for temperature recorded each hour through one day.1 mark
- Choose a display to look up the exact price of each lunch item.1 mark
- What does the vertical axis of the supplied fruit graph measure?1 mark
- Equal grid intervals on a graph are labelled 0, 2, 4, 8, 10. Is this scale fair?2 marks
- Draw a column graph for Cat 4, Dog 6, Bird 2. Give it a title, labels and fair scale.3 marks
Read the worked solutions
Equivalent correct methods earn the corresponding marks. Include units where asked.
- Choose a display for the number of pupils choosing each of four sports.1 mark
The sports are separate categories; compare their counts.
A column graph. - Choose a display for temperature recorded each hour through one day.1 mark
Ordered time shows how a measurement changes.
A line graph. - Choose a display to look up the exact price of each lunch item.1 mark
A table pairs each item with its exact price.
A table. - What does the vertical axis of the supplied fruit graph measure?1 mark
The axis label names the count represented by column height.
Number of votes. - Equal grid intervals on a graph are labelled 0, 2, 4, 8, 10. Is this scale fair?2 marks
The changes are 2, 2, 4 and 2.
A consistent scale could be 0, 2, 4, 6, 8.
No. Equal distances must represent equal changes. - Draw a column graph for Cat 4, Dog 6, Bird 2. Give it a title, labels and fair scale.3 marks
Use equal-width columns and equal gaps.
Label each category and the number axis.
A valid graph has Cat, Dog and Bird columns of heights 4, 6 and 2; title Favourite pet; vertical axis Votes from 0 to 6 in equal steps.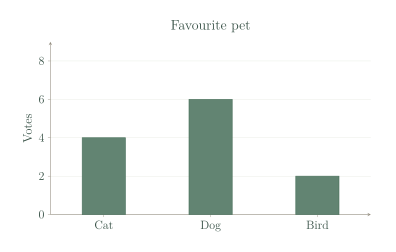
Curriculum reference & lesson scope
Australian Curriculum v9 / SA Curriculum 2026
Data types/validation; mode; suitable displays; line graphs; statistical investigations.
Official curriculum source ↗