
Understand the idea.
Read both axes
A point on a line graph connects two pieces of information: when the reading was taken and the measured value. Start at the time on the horizontal axis, move to its point, then read across to the vertical scale and include the unit.
Check the scale spacing carefully: the seedling graph marks heights in steps of , so the point halfway between and means . A value between recorded times is an estimate, not an extra measurement.
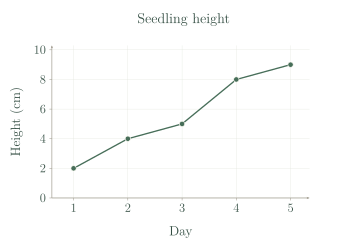
Describe the change
A point's height tells you the value at one time. To find an increase, compare two readings and subtract the earlier value from the later value. A horizontal section has equal readings at its ends, so it shows no measured change between them.
When drawing, give equal time intervals equal spaces and keep the number scale even. Plot the time and measurement pairs, then join neighbouring times in order. A title and units help the reader explain the change using actual measurements.
| Day | Height (cm) |
|---|---|
| 1 | 2 |
| 2 | 4 |
| 3 | 5 |
| 4 | 8 |
| 5 | 9 |
See the method in action.
Read and compare
How tall was the seedling on day 4? How much did it grow from day 3 to day 4?
Worked solution
- 1
Read the point above day four.
Its height lines up with on the height axis, whose unit is centimetres.
- 2
Read the earlier height on day three.
The point lies halfway between the and centimetre scale marks.
- 3
Subtract the earlier height from the later height.
The difference measures the growth, so the seedling was tall after growing over that interval.
8 cm tall, with growth of 3 cm.
A falling section
A container holds 12 litres at 9 am, 9 litres at 10 am and 9 litres at 11 am. Describe its line graph.
Worked solution
- 1
Match the three times to their volume readings.
Time belongs on the horizontal axis and volume in litres on the vertical axis.
- 2
Find the fall between the first two readings.
The later reading is smaller, so the joining section falls by three litres.
- 3
Compare the final two readings.
Equal endpoint readings give a horizontal section from to at .
It falls by 3 litres, then stays at 9 litres.
Try it yourself.
Check your understanding
What is the seedling's growth from day 1 to day 5?
Show answer & reasoning
7 cm.
Read on day one and on day five. The increase is ; the starting height is not part of the growth during these recorded days.
Keep practising
6 worksheet questions · 10 marks
Read the questions online
- Read the seedling's height on day 2.1 mark
- How much did the seedling grow from day 2 to day 3?1 mark
One seedling measured at the same time each day Day Height (cm) 1 2 2 4 3 5 4 8 5 9 - Between which neighbouring days was its largest increase?2 marks
One seedling measured at the same time each day Day Height (cm) 1 2 2 4 3 5 4 8 5 9 - Readings are 5, 5, 7 at 1, 2, 3 pm. Describe the first section of a line graph.1 mark
- Draw a line graph for times 0, 1, 2, 3 seconds and distances 0, 2, 4, 6 metres.3 marks
- A graph joins day 1 height 2 cm to day 2 height 4 cm. Is the halfway height of 3 cm a measured reading?2 marks
Read the worked solutions
Equivalent correct methods earn the corresponding marks. Include units where asked.
- Read the seedling's height on day 2.1 mark
Locate day 2, then read the height of its point.
4 cm. - How much did the seedling grow from day 2 to day 3?1 mark
One seedling measured at the same time each day Day Height (cm) 1 2 2 4 3 5 4 8 5 9 cm.
1 cm. - Between which neighbouring days was its largest increase?2 marks
One seedling measured at the same time each day Day Height (cm) 1 2 2 4 3 5 4 8 5 9 The increases are 2, 1, 3 and 1 cm.
3 cm is the greatest.
Days 3 and 4. - Readings are 5, 5, 7 at 1, 2, 3 pm. Describe the first section of a line graph.1 mark
Both readings are 5.
Horizontal: the reading stays at 5 between 1 and 2 pm. - Draw a line graph for times 0, 1, 2, 3 seconds and distances 0, 2, 4, 6 metres.3 marks
Use equal steps on each axis.
The distance increases by 2 metres each second, so the plotted points form a straight line.
Plot , , , and join in time order. Label Time (seconds), Distance (metres), and a suitable title.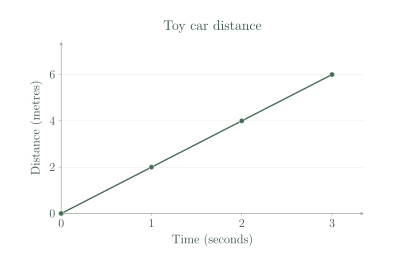
- A graph joins day 1 height 2 cm to day 2 height 4 cm. Is the halfway height of 3 cm a measured reading?2 marks
Only the day 1 and day 2 measurements were supplied.
The seedling may not have grown at a constant rate between them.
No. It is an estimate between two recorded readings.
Curriculum reference & lesson scope
Australian Curriculum v9 / SA Curriculum 2026
Data types/validation; mode; suitable displays; line graphs; statistical investigations.
Official curriculum source ↗