
Understand the idea.
Split the ordered data consistently
Order the values before finding quartiles. This lesson uses the median of each half, excluding a single overall median from both halves. Software conventions can differ, so use one stated convention consistently when comparing small samples.
The five-number summary is minimum, , median, , maximum. The interquartile range, , measures the central half's span and is less affected by an isolated extreme than the full range.
Read proportions and distances
The box extends from to , with a median line inside. Here the unmodified whiskers reach the minimum and maximum. A modified plot can display flagged outliers separately, so first check which convention is used.
Quartile sections represent approximately equal shares of the cases, not equal axis distances. A longer section indicates more numerical spread. A box plot does not reveal the sample size, gaps or every individual observation.
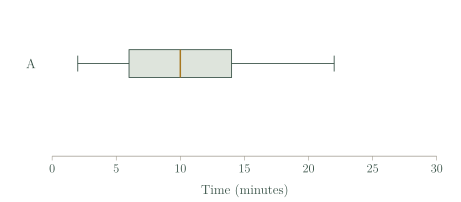
See the method in action.
Find five numbers
Summarise 2, 4, 5, 7, 8, 10, 12, 16.
Worked solution
- 1
Find the overall median.
Eight ordered values have their centre between positions four and five.
- 2
Find the median of each half.
The lower half is the first four values; the upper half is the last four.
- 3
Record the five-number summary.
The first and last ordered values supply the two endpoints.
- 4
Find the interquartile range.
Subtract the lower quartile from the upper quartile to measure the middle half's spread.
(2, 4.5, 7.5, 11, 16); IQR 6.5.
Interpret the middle half
Q1 is 12 min and Q3 is 20 min. What does that show?
Worked solution
- 1
Interpret the two quartile boundaries.
Approximately the middle half of the observations lies between these boundaries.
- 2
Subtract to find central spread.
IQR is a distance between quartiles, not an additional observation.
- 3
State the limit of the interval.
The twelve-to-twenty-minute span describes the middle half; observations can lie below twelve or above twenty.
The middle half spans 12–20 min; IQR 8 min, not all observations.
Try it yourself.
Check your understanding
Q1=9, Q3=17. Find IQR.
Show answer & reasoning
8.
The IQR is upper quartile minus lower quartile: . Subtracting in this order produces a non-negative spread.
Keep practising
6 worksheet questions · 12 marks
Read the questions online
- Summarise 1, 3, 4, 6, 8, 10, 11, 15.2 marks
- Find IQR for that set.2 marks
- Exclude the median to find , median, for 2, 4, 7, 9, 11, 14, 18.2 marks
- A summary is (3, 8, 12, 18, 27). Find range and IQR.2 marks
- Can box plots alone show which group contains more people?2 marks
- What does a long upper whisker suggest?2 marks
Read the worked solutions
Equivalent correct methods earn the corresponding marks. Include units where asked.
- Summarise 1, 3, 4, 6, 8, 10, 11, 15.2 marks
Median 7; lower/upper half medians 3.5 and 10.5.
(1, 3.5, 7, 10.5, 15). - Find IQR for that set.2 marks
.
7. - Exclude the median to find , median, for 2, 4, 7, 9, 11, 14, 18.2 marks
Exclude 9; use medians of 2, 4, 7 and 11, 14, 18.
4, 9, 14. - A summary is (3, 8, 12, 18, 27). Find range and IQR.2 marks
; .
Range 24; IQR 10. - Can box plots alone show which group contains more people?2 marks
They show summary positions and proportions, not counts.
No, unless sample sizes are given separately. - What does a long upper whisker suggest?2 marks
It does not prove why or reveal individual values.
Higher observations extend across a wide interval.
Curriculum reference & lesson scope
SACE Board of South Australia
Stage 1 General Mathematics: statistical investigation, univariate data, sampling, displays, summaries and interpretation.
Official curriculum source ↗