
Understand the idea.
Different mechanisms
For equal input steps, a linear model has constant differences; a positive exponential model has constant ratios. Calculate both when identifying a pattern. A short curve can look almost straight, so appearance alone is weak evidence.
Adding twenty units and adding twenty percent are different instructions. The first adds a fixed amount; the second multiplies the current amount by , so its added amount changes as the base changes.
Compare fairly
Compare models at the same input values with the same units and allowed domains. A table can reveal when their order changes. For continuous models, opposite order at two inputs establishes a crossing between them because their difference is continuous.
Choose a model using its mechanism and agreement with measurements. A larger long-term forecast does not make a model more realistic. Both linear and exponential rules can cease to apply when conditions change.
See the method in action.
Same start, different change
Compare and at years 0 to 4.
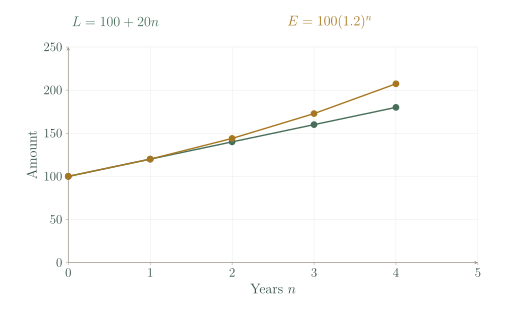
| n | 0 | 1 | 2 | 3 | 4 |
|---|---|---|---|---|---|
| L | 100 | 120 | 140 | 160 | 180 |
| E | 100 | 120 | 144 | 172.8 | 207.36 |
Worked solution
- 1
Calculate the linear values.
The linear model adds twenty at each yearly step.
- 2
Calculate the exponential values.
The exponential model multiplies by one point two each year.
- 3
Compare at matching years.
Agreement at the first two inputs does not continue at the remaining listed years.
At year 4: L = 180 and E = 207.36.
A later change of order
Compare and at times 8 and 9.
Worked solution
- 1
Evaluate both models at eight.
The linear prediction is larger at this common input.
- 2
Evaluate both models at nine.
The exponential prediction is larger at the next whole reporting time.
- 3
Interpret the reversal.
If both rules apply continuously, a crossing occurs between eight and nine; the listed whole-time order has reversed by nine.
L is larger at 8; E is larger at 9.
Try it yourself.
Check your understanding
At consecutive inputs, outputs are 10, 15, 20, 25. Which simple model fits exactly?
Show answer & reasoning
A linear model.
The consecutive differences are , and . The fixed increase identifies a linear model; the ratios are unequal.
Keep practising
6 worksheet questions · 13 marks
Read the questions online
- Classify 40, 50, 60, 70 and give a rule starting at .2 marks
- Classify 40, 60, 90, 135 and give a rule.2 marks
- Compare and at .2 marks
- Find the differences for 100, 110, 121, 133.1 and identify its change.2 marks
- One tank loses 4 L/min; another loses 4% of its current volume per minute. Identify the model types.2 marks
- Why might neither an unrestricted linear nor an exponential model describe a population indefinitely?3 marks
Read the worked solutions
Equivalent correct methods earn the corresponding marks. Include units where asked.
- Classify 40, 50, 60, 70 and give a rule starting at .2 marks
Constant difference is 10.
Linear; . - Classify 40, 60, 90, 135 and give a rule.2 marks
Each ratio is 1.5.
Exponential; . - Compare and at .2 marks
Substitute the same time in both models.
is larger. - Find the differences for 100, 110, 121, 133.1 and identify its change.2 marks
Differences vary but consecutive ratios are all 1.1.
10, 11, 12.1; exponential factor 1.1. - One tank loses 4 L/min; another loses 4% of its current volume per minute. Identify the model types.2 marks
One removes a fixed amount; the other applies factor 0.96.
The first is linear; the second is exponential. - Why might neither an unrestricted linear nor an exponential model describe a population indefinitely?3 marks
A simple rule may ignore crowding, migration or limited food.
State a useful domain and check new observations.
Resources, capacity and conditions may change.
Curriculum reference & lesson scope
SACE Board of South Australia
Stage 1 General Mathematics: algebraic and graphical modelling of linear/exponential change, with interpretation and evaluation.
Official curriculum source ↗