
Understand the idea.
Preserve counts
A frequency is the number of observations in a category or interval. Add frequencies to check the valid sample size. Divide a category count by that total for relative frequency, then multiply by for percentage.
Intervals must assign every valid observation exactly once. In , the lower endpoint is included and the upper endpoint is excluded. State whether missing responses are outside the denominator.
Match the graph to the data
Use separated bars for categories and adjoining histogram intervals for grouped numerical values. With equal interval widths, histogram height can show frequency directly. Dot plots retain individual values; box plots condense centre and spread.
Choose a line graph when time order matters, rather than joining unrelated categories. Label variables, units and scales. Bar lengths normally start at zero so their visual ratios agree with the quantities represented.
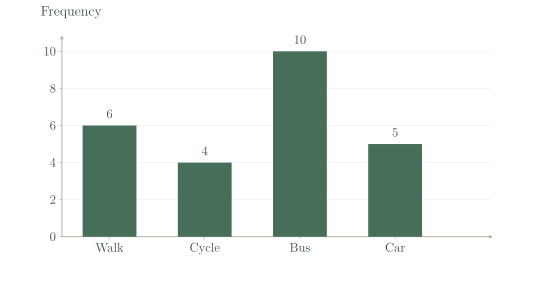
| Method | Walk | Cycle | Bus | Car |
|---|---|---|---|---|
| Frequency | 6 | 4 | 10 | 5 |
See the method in action.
Relative frequency
Ten of 25 students use a bus. Find relative frequency and percentage.
Worked solution
- 1
Identify the favourable and total counts.
The relative frequency compares bus users with all valid student responses.
- 2
Divide by the total.
Relative frequency expresses the bus count as a fraction of the sample.
- 3
Convert the proportion to a percentage.
A percentage gives the equivalent count per hundred.
0.4, or 40%.
Boundary values
Group 8, 10, 19, 20, 28 into , , .
Worked solution
- 1
Fill the first interval.
Eight is below ten, while ten is excluded from this interval.
- 2
Fill the second interval.
Ten is included at the lower boundary; twenty is excluded at the upper boundary.
- 3
Fill the third interval and check the count.
Twenty enters this interval, and the frequencies sum to all five observations.
Frequencies 1, 2, 2.
Try it yourself.
Check your understanding
Counts are 7, 12, 6. What is the total?
Show answer & reasoning
25.
The total is . Summing mutually exclusive category counts counts each valid response once.
Keep practising
6 worksheet questions · 12 marks
Read the questions online
- Counts are 6, 4, 10, 5. Find total and the third category’s percentage.2 marks
- Choose a display for favourite music genre.2 marks
- Choose a display for hourly temperature during one day.2 marks
- Group 3, 7, 10, 14, 19, 20 into intervals [0, 10), [10, 20), [20, 30).2 marks
- Why can starting a bar axis at 90 exaggerate differences?2 marks
- There are 18 valid and 2 missing replies. Nine valid replies choose A. Find A’s percentage among valid replies.2 marks
Read the worked solutions
Equivalent correct methods earn the corresponding marks. Include units where asked.
- Counts are 6, 4, 10, 5. Find total and the third category’s percentage.2 marks
Total 25; .
25; 40%. - Choose a display for favourite music genre.2 marks
The variable is categorical.
A bar chart. - Choose a display for hourly temperature during one day.2 marks
Time is ordered and change is meaningful.
A time-series line graph. - Group 3, 7, 10, 14, 19, 20 into intervals [0, 10), [10, 20), [20, 30).2 marks
Boundary values enter intervals starting there.
2, 3, 1. - Why can starting a bar axis at 90 exaggerate differences?2 marks
Small numerical differences can appear proportionally huge.
Bar lengths omit most of the values below 90. - There are 18 valid and 2 missing replies. Nine valid replies choose A. Find A’s percentage among valid replies.2 marks
.
50%.
Curriculum reference & lesson scope
SACE Board of South Australia
Stage 1 General Mathematics: statistical investigation, univariate data, sampling, displays, summaries and interpretation.
Official curriculum source ↗