
Understand the idea.
Make comparisons fair
Before comparing groups, check that they measure the same variable in the same units and under comparable conditions. Use common graph scales and report sample sizes and selection methods, since collection differences can mimic group differences.
Compare shape, centre, spread and unusual values. Explain what the context values: a lower typical wait may be desirable, while a higher typical score may be desirable. Spread alone does not identify a “better” group.
Support the sentence with numbers
Write comparisons with paired evidence: name each group and give both medians and both IQRs. Explain a lower median as a lower typical value and a lower IQR as a narrower middle half, keeping units attached.
A group summary does not describe every individual. Overlap can allow some observations to reverse the typical ordering. An observed difference also does not establish causation without a study design that rules out competing explanations.
See the method in action.
Compare service
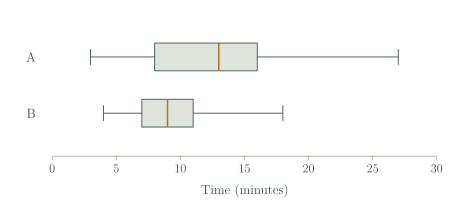
A median 13/IQR 8; B median 9/IQR 4, all minutes. Compare.
Worked solution
- 1
Compare typical waiting time.
B's median wait is four minutes lower than A's.
- 2
Compare central variability.
B's IQR is four minutes smaller, so its middle half occupies a narrower interval.
- 3
Interpret both measures in context.
For these measured visits, B was typically faster and more consistent through its middle half; the summaries do not guarantee every B visit was faster.
B was typically faster and its middle half was more consistent.
Group and individual
A median score 72; B median 68, with overlapping ranges. Must every A score be higher?
Worked solution
- 1
Compare the medians.
A has the higher middle score, which describes typical level rather than every score.
- 2
Consider the individual observations.
Overlapping ranges permit scores from the two groups to lie in a different order from their medians.
- 3
Reject the universal claim.
No: the given summaries do not establish that every A score exceeds every B score. Individual records would be needed to establish such an ordering.
No; higher typical score does not order all individuals.
Try it yourself.
Check your understanding
Equal medians; IQRs 3 and 9. Which is tighter centrally?
Show answer & reasoning
IQR 3 group.
The group with is tighter centrally because its middle half spans three units rather than nine. Equal medians establish equal centres, not equal spreads.
Keep practising
6 worksheet questions · 12 marks
Read the questions online
- Scores A median 25/IQR 6; B median 29/IQR 10. Compare.2 marks
- Why should two travel histograms share a horizontal scale?2 marks
- Compare one class before exams with another during holidays. Name a limitation.2 marks
- Groups have means 10, 12 and SDs 4, 1. Compare.2 marks
- Does a random sample of 80 necessarily give a closer mean than a sample of 8?2 marks
- A report says only “A is better”. Improve the approach.2 marks
Read the worked solutions
Equivalent correct methods earn the corresponding marks. Include units where asked.
- Scores A median 25/IQR 6; B median 29/IQR 10. Compare.2 marks
Use centre and spread separately.
B has median 4 points higher but wider middle-half spread. - Why should two travel histograms share a horizontal scale?2 marks
The same minutes should occupy the same width.
Otherwise equal time differences can appear different. - Compare one class before exams with another during holidays. Name a limitation.2 marks
Use comparable periods or qualify the inference.
Time conditions differ and may affect sleep/study observations. - Groups have means 10, 12 and SDs 4, 1. Compare.2 marks
The SD comparison is not a sample-size statement.
Second group has higher mean and tighter concentration around it. - Does a random sample of 80 necessarily give a closer mean than a sample of 8?2 marks
Larger samples generally reduce random variation but cannot guarantee exactness.
No, not for every realised sample. - A report says only “A is better”. Improve the approach.2 marks
A value judgement needs a defined criterion and evidence.
Name the outcome and compare specific medians/IQRs or justified summaries.
Curriculum reference & lesson scope
SACE Board of South Australia
Stage 1 General Mathematics: statistical investigation, univariate data, sampling, displays, summaries and interpretation.
Official curriculum source ↗