
Understand the idea.
Compare the counts
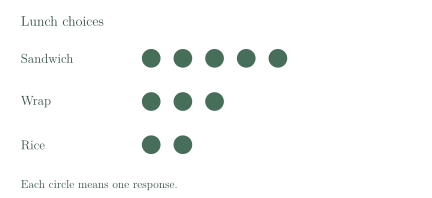
To check whether a table and picture display match, compare the same named group in each. Here Sandwich has , Wrap has and Rice has in both. They show the same choices in different ways.
The most is the largest count and the fewest is the smallest. To find how many more chose one food, match one response from each group. The unmatched responses give the difference; sandwich has more than wrap.
| Food | Children |
|---|---|
| Sandwich | 5 |
| Wrap | 3 |
| Rice | 2 |
Stay within the information
Support a conclusion with a count. Sandwich was chosen most often in this group because its five choices exceed both three and two. Say which group you mean so the reader knows whose choices the statement describes.
The counts describe the ten children who answered. They do not tell us every child's choice in the school, or why these children chose their lunches. To find reasons, we would need to ask another question and record the answers.
See the method in action.
Compare two rows
How many more children chose sandwich than rice?
| Food | Children |
|---|---|
| Sandwich | 5 |
| Wrap | 3 |
| Rice | 2 |
Worked solution
- 1
Read the two counts being compared.
The question compares sandwich with rice, so the wrap count is not needed for this difference.
- 2
Subtract the smaller count from the larger.
Matching two rice choices to two sandwich choices leaves three sandwich choices unmatched.
- 3
Use the difference to answer the question.
Sandwich has the larger count, so three more children chose sandwich than rice.
3 more children chose sandwich.
Check a second display
Another display shows Sandwich 5, Wrap 2, Rice 3. Does it match the table?
| Food | Children |
|---|---|
| Sandwich | 5 |
| Wrap | 3 |
| Rice | 2 |
Worked solution
- 1
Compare the sandwich counts.
Both the table and the second display give five sandwich choices, so this row agrees.
- 2
Compare wrap and rice with their table rows.
The display gives wrap two instead of three, and rice three instead of two. These two counts have been swapped.
- 3
Check why an equal total is not enough.
Both totals are ten, but they put different numbers in the wrap and rice groups. Every named group's count must agree.
- 4
State the two counts needed to match.
The table records three wrap choices and two rice choices, so the other display does not match it.
No. Wrap should be 3 and Rice should be 2.
Try it yourself.
Check your understanding
Red has 4 responses and Blue has 4. Can we say red was chosen more often?
Show answer & reasoning
No. They were chosen equally often.
Red and Blue each have four responses. Their difference is , so neither was chosen more often. They were chosen equally often.
Keep practising
6 worksheet questions
Read the questions online
- Which lunch was chosen most often?
Lunch choices: one choice per child. Food Children Sandwich 5 Wrap 3 Rice 2 - How many children answered the lunch question?
Lunch choices: one choice per child. Food Children Sandwich 5 Wrap 3 Rice 2 - How many fewer children chose rice than wrap?
Lunch choices: one choice per child. Food Children Sandwich 5 Wrap 3 Rice 2 - A picture display has Animals 4, Space 2 and Stories 5. Does it match the book table? Explain.
Books chosen by a group. Type Number Animals 4 Space 2 Stories 5 - Can the vehicle table tell us which car colour was most common? Explain.
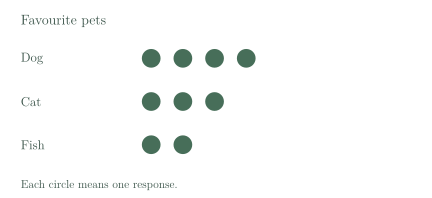
Vehicles observed in five minutes. Vehicle Number Car 6 Bus 2 Bicycle 3 - Write one conclusion supported by the pet display, and one question it cannot answer.
Read the worked solutions
- Which lunch was chosen most often?
Lunch choices: one choice per child. Food Children Sandwich 5 Wrap 3 Rice 2 Five is larger than three and two.
Sandwich. - How many children answered the lunch question?
Lunch choices: one choice per child. Food Children Sandwich 5 Wrap 3 Rice 2 .
10 children. - How many fewer children chose rice than wrap?
Lunch choices: one choice per child. Food Children Sandwich 5 Wrap 3 Rice 2 .
1 fewer child. - A picture display has Animals 4, Space 2 and Stories 5. Does it match the book table? Explain.
Books chosen by a group. Type Number Animals 4 Space 2 Stories 5 All three counts agree: .
Yes. - Can the vehicle table tell us which car colour was most common? Explain.
Vehicles observed in five minutes. Vehicle Number Car 6 Bus 2 Bicycle 3 It records vehicle types, not car colours.
We would need to record car colours to answer that question.
No. - Write one conclusion supported by the pet display, and one question it cannot answer.
Use the counts to support the conclusion.
A question about reasons needs more information.
For example: dog is the most common choice in this group; the display cannot tell us why children chose dog.
Curriculum reference & lesson scope
Australian Curriculum v9; SA Curriculum Mathematics 2026
Surveys/observations; lists/tables; creating displays; comparing representations and conclusions.
Official curriculum source ↗