
Understand the idea.
Choose a display
A graph turns counts into a picture we can compare. In a one-to-one picture graph, one picture represents one response. Use the same-sized picture each time and line up the rows so their lengths can be compared.
Give the graph a title, label each category and write a key explaining the pictures. For the fruit table, one picture per child means six apple pictures, four banana pictures and two orange pictures.
| Fruit | Children |
|---|---|
| Apple | 6 |
| Banana | 4 |
| Orange | 2 |
Build a column graph
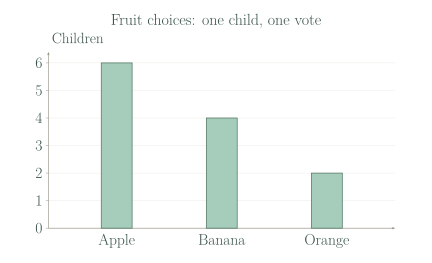
A column graph shows each count by the height of a column. Begin at and keep the gaps on the number scale equal. When the scale counts in ones, each gap represents one more child.
Draw equal-width columns from zero up to the correct counts. In the fruit graph, the columns reach , and . To read one, follow its top across to the number scale.
See the method in action.
Read a column
Use the fruit graph. How many children chose banana?
Worked solution
- 1
Find the Banana label.
The label underneath tells us which column records banana choices.
- 2
Read across from the column top.
The top lines up with four on the scale; we read height, rather than column width.
- 3
State what the count represents.
The graph counts children, so four children chose banana.
4 children.
Plan a picture graph
Dog has 3 votes and Cat has 2 votes. One picture means one child. Describe the display.
Worked solution
- 1
Choose a title and label the two rows.
A title such as Pet choices and the row labels Dog and Cat identify what the display shows.
- 2
Draw one equal-sized picture per vote.
The key is one picture for one child, so the picture counts must match the vote counts.
- 3
Write the key and check the total.
The key says one picture means one child, and five pictures represent the five votes altogether.
Dog: 3 pictures. Cat: 2 pictures. The key says one picture means one child.
Try it yourself.
Check your understanding
A column reaches 5 on a scale marked in ones. What count does it show?
Show answer & reasoning
5.
Read the number level with the top of the column. Its top reaches on the one-by-one scale, so its count is five.
Keep practising
6 worksheet questions
Read the questions online
- Draw a picture graph for Red 4, Blue 2, Green 3. Let one circle mean one vote.
- A column ends at 6 on a number scale in ones. What count does it show?
- Complete the equally spaced scale: .
- One star means one book. A row has 7 stars. How many books does it show?
- A graph is titled “Favourite sports” but its columns have no names. What labels are needed?
- Draw a column graph for the supplied table. Start at 0 and count in ones.
Sample data: After-lunch choices Activity Children Drawing 5 Reading 3 Puzzles 4
Read the worked solutions
- Draw a picture graph for Red 4, Blue 2, Green 3. Let one circle mean one vote.
Copy each frequency exactly.
There should be 9 circles altogether.
Labelled rows with equal circles; a title and a key. - A column ends at 6 on a number scale in ones. What count does it show?
Read the top of the column.
6. - Complete the equally spaced scale: .
Each step adds 1.
2 and 4. - One star means one book. A row has 7 stars. How many books does it show?
Each of the 7 stars represents one book.
7 books. - A graph is titled “Favourite sports” but its columns have no names. What labels are needed?
Readers need to match each column to its category.
The sport names. - Draw a column graph for the supplied table. Start at 0 and count in ones.
Sample data: After-lunch choices Activity Children Drawing 5 Reading 3 Puzzles 4 Use each table frequency as the column height.
Check children.
Heights: Drawing 5, Reading 3, Puzzles 4. Use equal widths, labels, a number scale and a title.
Curriculum reference & lesson scope
Australian Curriculum v9 / South Australian Curriculum
Categorical/count data; recording; displays; comparisons; guided question-to-conclusion investigation.
Official curriculum source ↗