
Understand the idea.
Compare like with like
Read the title, key and both axes before comparing bars. Here the horizontal labels give books finished, while each frequency counts students. A bar of height above book means four students each finished one book.
Check the group totals and use the same scale. Each class here contains ten students. If group sizes differ, counts can still be compared, but a larger count alone does not establish a larger fraction of the group.
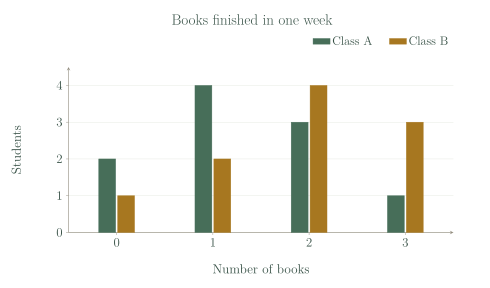
| Books finished | Class A frequency | Class B frequency |
|---|---|---|
| 0 | 2 | 1 |
| 1 | 4 | 2 |
| 2 | 3 | 4 |
| 3 | 1 | 3 |
Describe a comparison with evidence
Match the comparison to the wording. Exactly two books uses only the two-book row. At least two books includes two and every larger value in the data, so combine the frequencies for two and three books.
Support a conclusion with both counts and totals: seven of ten Class B students finished at least two books, compared with four of ten in Class A. This describes the recorded week; it does not explain why the classes differ.
See the method in action.
Compare a single value
Using the supplied table, how many more Class B students than Class A students finished exactly three books?
| Books finished | Class A frequency | Class B frequency |
|---|---|---|
| 0 | 2 | 1 |
| 1 | 4 | 2 |
| 2 | 3 | 4 |
| 3 | 1 | 3 |
Worked solution
- 1
Select the three-book row.
Exactly three books excludes every other row of the table.
- 2
Subtract the two frequencies.
How many more asks for the difference between the student counts.
- 3
State which class has the larger count.
Class B has two more students who finished exactly three books.
2 more students.
Combine categories
Using the table, compare the numbers who finished at least two books.
| Books finished | Class A frequency | Class B frequency |
|---|---|---|
| 0 | 2 | 1 |
| 1 | 4 | 2 |
| 2 | 3 | 4 |
| 3 | 1 | 3 |
Worked solution
- 1
Choose the rows that count.
At least two includes two itself and every larger number listed.
- 2
Combine Class A's frequencies.
The two groups of students occupy different rows, so add their counts.
- 3
Combine Class B's frequencies.
These are the Class B counts for the same two book totals.
- 4
Compare using the equal class sizes.
Class B has seven of ten students compared with four of ten in Class A, a difference of three students.
Class B: 7 of 10; Class A: 4 of 10.
Try it yourself.
Check your understanding
In the supplied data, which class has more students who finished no books?
Show answer & reasoning
Class A.
Use the zero-book row, because no books means exactly zero. It records students in Class A and in Class B, so Class A has more.
Keep practising
6 worksheet questions · 11 marks
Read the questions online
- Using the table, how many Class A students finished exactly one book?1 mark
Practice data: books finished during one week by ten students in each class Books finished Class A frequency Class B frequency 0 2 1 1 4 2 2 3 4 3 1 3 - Using the table, how many students are recorded in Class B?2 marks
Practice data: books finished during one week by ten students in each class Books finished Class A frequency Class B frequency 0 2 1 1 4 2 2 3 4 3 1 3 - How many students across both classes finished exactly two books?2 marks
Practice data: books finished during one week by ten students in each class Books finished Class A frequency Class B frequency 0 2 1 1 4 2 2 3 4 3 1 3 - Compare the numbers who finished zero or one book.2 marks
Practice data: books finished during one week by ten students in each class Books finished Class A frequency Class B frequency 0 2 1 1 4 2 2 3 4 3 1 3 - A different school compares 8 students out of 10 with 12 students out of 30. Why is comparing 8 and 12 alone unfair?2 marks
- Write a true comparison about the two classes using a number from the table.2 marks
Practice data: books finished during one week by ten students in each class Books finished Class A frequency Class B frequency 0 2 1 1 4 2 2 3 4 3 1 3
Read the worked solutions
Equivalent correct methods earn the corresponding marks. Include units where asked.
- Using the table, how many Class A students finished exactly one book?1 mark
Practice data: books finished during one week by ten students in each class Books finished Class A frequency Class B frequency 0 2 1 1 4 2 2 3 4 3 1 3 Read Class A at the value 1 book.
4 students. - Using the table, how many students are recorded in Class B?2 marks
Practice data: books finished during one week by ten students in each class Books finished Class A frequency Class B frequency 0 2 1 1 4 2 2 3 4 3 1 3 Add the frequencies: .
10 students. - How many students across both classes finished exactly two books?2 marks
Practice data: books finished during one week by ten students in each class Books finished Class A frequency Class B frequency 0 2 1 1 4 2 2 3 4 3 1 3 Class A has 3 and Class B has 4.
.
7 students. - Compare the numbers who finished zero or one book.2 marks
Practice data: books finished during one week by ten students in each class Books finished Class A frequency Class B frequency 0 2 1 1 4 2 2 3 4 3 1 3 Class A: .
Class B: .
Class A: 6; Class B: 3. - A different school compares 8 students out of 10 with 12 students out of 30. Why is comparing 8 and 12 alone unfair?2 marks
Twelve is a larger count, but it comes from three times as many students.
Compare parts of equally sized groups or proportions before deciding.
The groups have different sizes. - Write a true comparison about the two classes using a number from the table.2 marks
Practice data: books finished during one week by ten students in each class Books finished Class A frequency Class B frequency 0 2 1 1 4 2 2 3 4 3 1 3 State the group names and the feature.
Use matching frequencies or combined categories. Other supported comparisons are valid.
For example, 7 of 10 Class B students finished at least two books, compared with 4 of 10 in Class A.
Curriculum reference & lesson scope
Australian Curriculum v9.0; SA Mathematics Curriculum 2026
Variable types; comparative displays; mode/range/shape; media claims; investigations.
Official curriculum source ↗