
Understand the idea.
One picture for one response
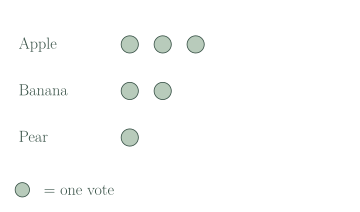
Read the key before counting a picture display. The key tells us what each symbol means. Here, one dot stands for one vote, so each dot counts as one.
Find the named row and touch or point to each dot once. Apple has three votes, banana has two and pear has one. The dot beside the key explains the symbols; it is not another vote.
Make the display fair
When making a display, use equal-sized dots with equal gaps and start each row in the same place. Then matching dots line up, making the counts easier to compare.
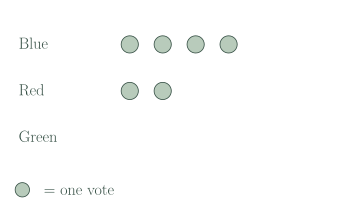
Keep the category name even when nobody chose it. Leave its row empty to show zero votes. Adding a dot to decorate an empty row would change the information.
See the method in action.
Read a row
How many votes did banana receive?
Worked solution
- 1
Read the key and find the banana row.
The key says one dot means one vote, and the banana row has two dots.
- 2
Count one vote for each dot.
The two dots represent 2 banana votes.
2 votes.
Show no choices
In the colour display, how many votes did green receive?
Worked solution
- 1
Find the row labelled Green.
We need the dots for green, rather than the dots in the blue or red rows.
- 2
Read the empty row as zero votes.
The green row has no dots, so nobody voted for green.
0 votes.
Try it yourself.
Check your understanding
The key says one star means one child. A row has four stars. How many children does it show?
Show answer & reasoning
4 children.
The key gives one child for each star. Count the four stars once each: . The row shows 4 children.
Keep practising
6 worksheet questions
Read the questions online
- In the fruit display, how many dots are in the apple row?
- In the fruit display, how many votes did pear receive?
- Draw a display for 2 red choices and 3 blue choices. Let one circle mean one choice.
- A row shows five pictures. Each picture means one response. How many responses are shown?
- In the colour display, what does the empty green row mean?
- Why should dots in different rows be the same size and equally spaced?
Read the worked solutions
- In the fruit display, how many dots are in the apple row?
Count the three symbols.
3. - In the fruit display, how many votes did pear receive?
Its row has one dot.
1 vote. - Draw a display for 2 red choices and 3 blue choices. Let one circle mean one choice.
Use equal symbols and keep the categories clear.
Two circles beside Red and three beside Blue, with a one-circle key. - A row shows five pictures. Each picture means one response. How many responses are shown?
Use the one-to-one key.
5 responses. - In the colour display, what does the empty green row mean?
No symbol means no response in that category.
Nobody chose green: 0 votes. - Why should dots in different rows be the same size and equally spaced?
The drawing should not make fewer votes look like a longer row.
It makes the rows easy and fair to compare.
Curriculum reference & lesson scope
Australian Curriculum v9 / SA Curriculum 2026
Year 1 categorical questions, response collection, lists, one-to-one displays and comparison of frequencies.
Official curriculum source ↗