
Understand the idea.
Frequency is a count
Frequency means how many answers are in a group. Read or count each group's answers, then compare the numbers. The greatest count has the most; the smallest has the fewest.
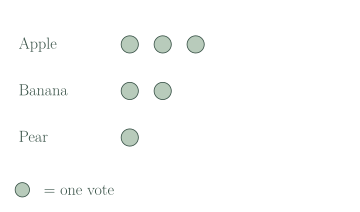
To find 'how many more', match one answer in one group with one in the other. Count the answers left over. Apple has three votes and pear has one, leaving two extra apple votes.
Equal counts can tie
Equal counts make a tie. In the travel table, three children walked and three rode bikes. Every walker can be matched with a bike rider, with nobody left over.
Describe only the answers you collected. The travel table tells us about these seven children. It does not tell us how all children travel to the park.
| Travel | Children |
|---|---|
| Walk | 3 |
| Bike | 3 |
| Bus | 1 |
See the method in action.
Compare fruits
Which fruit received the most votes, and how many more than pear?
| Fruit | Votes |
|---|---|
| Apple | 3 |
| Banana | 2 |
| Pear | 1 |
Worked solution
- 1
Compare all three fruit counts.
Apple has 3 votes, banana has 2 and pear has 1, so apple has the most.
- 2
Match pear's one vote with one apple vote.
Two apple votes remain unmatched, so apple received 2 more votes than pear.
Apple; 2 more votes.
A tied result
Did more children walk or ride bikes to the park?
| Travel | Children |
|---|---|
| Walk | 3 |
| Bike | 3 |
| Bus | 1 |
Worked solution
- 1
Read the Walk and Bike counts.
Both rows show 3 children.
- 2
Describe the equal counts as a tie.
There are no extra children in either group, so neither walking nor riding a bike has more.
Neither: the counts are tied at 3.
Try it yourself.
Check your understanding
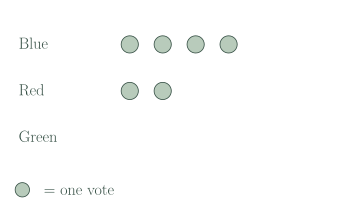
A display has 4 blue, 2 red and 0 green votes. Which colour has the fewest votes?
Show answer & reasoning
Green.
Green has no votes. Since and , green's count is the smallest, so green has the fewest votes.
Keep practising
6 worksheet questions
Read the questions online
- Which fruit has the fewest votes in the table?
Favourite fruit: one choice from each of six children. Fruit Votes Apple 3 Banana 2 Pear 1 - How many more apple votes than banana votes are there?
Favourite fruit: one choice from each of six children. Fruit Votes Apple 3 Banana 2 Pear 1 - In the travel table, which two categories tie?
How seven children travelled to a park. Travel Children Walk 3 Bike 3 Bus 1 - How many travel responses are recorded altogether?
How seven children travelled to a park. Travel Children Walk 3 Bike 3 Bus 1 - Is this true for the fruit table: Every child chose apple? Explain.
Favourite fruit: one choice from each of six children. Fruit Votes Apple 3 Banana 2 Pear 1 - Write one true comparison about the colour display.
Read the worked solutions
- Which fruit has the fewest votes in the table?
Favourite fruit: one choice from each of six children. Fruit Votes Apple 3 Banana 2 Pear 1 One is the smallest count.
Pear. - How many more apple votes than banana votes are there?
Favourite fruit: one choice from each of six children. Fruit Votes Apple 3 Banana 2 Pear 1 .
1 more. - In the travel table, which two categories tie?
How seven children travelled to a park. Travel Children Walk 3 Bike 3 Bus 1 Each has 3 children.
Walk and bike. - How many travel responses are recorded altogether?
How seven children travelled to a park. Travel Children Walk 3 Bike 3 Bus 1 .
7. - Is this true for the fruit table: Every child chose apple? Explain.
Favourite fruit: one choice from each of six children. Fruit Votes Apple 3 Banana 2 Pear 1 Only 3 of the 6 recorded children chose apple; banana and pear also have votes.
No. - Write one true comparison about the colour display.
Check the counts blue 4, red 2, green 0.
Answers vary: blue has more votes than red; green has none; blue has 2 more than red.
Curriculum reference & lesson scope
Australian Curriculum v9 / SA Curriculum 2026
Year 1 categorical questions, response collection, lists, one-to-one displays and comparison of frequencies.
Official curriculum source ↗