
Understand the idea.
Match the display to the question
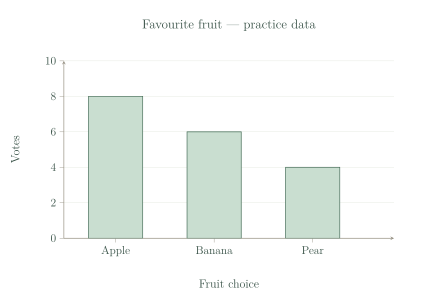
Choose a display to suit the question. A frequency table places each category beside its exact count. A column graph helps readers compare the counts quickly, and a pictograph groups counts using repeated symbols.
The fruit counts remain the same whichever display you choose. The display changes how the information is shown, so select one that makes the required reading or comparison easy.
| Fruit | Votes |
|---|---|
| Apple | 8 |
| Banana | 6 |
| Pear | 4 |
Make it readable and fair
Give a count graph a title, category labels and a numbered scale starting at zero. Equal spaces on that scale must represent equal increases. Use columns of equal width with equal gaps so the counts are compared fairly.
For a pictograph, choose a simple key and show it clearly. A useful key divides the counts into easy groups. If it requires awkward parts of symbols, a column graph or table may be easier to read.
See the method in action.
An exact value
A teacher needs the exact number choosing each lunch option. What simple display is useful?
Worked solution
- 1
Identify what the teacher needs.
The task asks for exact counts for each lunch option, rather than a quick visual comparison.
- 2
Choose a frequency table.
A table pairs each option directly with its number of responses.
- 3
Label the categories and count column.
Clear headings explain what each number counts, making the exact values useful.
A labelled frequency table.
A suitable key
A survey has category counts 4, 8 and 12. Choose a pictograph key that uses only whole symbols.
Worked solution
- 1
Try a key of four responses per symbol.
Four divides each of the supplied counts without a remainder.
- 2
Find the number of symbols for each count.
Divide each total by the amount represented by one symbol.
- 3
Confirm that the key works.
All three categories need only whole symbols: one, two and three respectively.
One symbol represents 4 responses.
Try it yourself.
Check your understanding
What three labels should a column graph include?
Show answer & reasoning
A title, category labels and a labelled numbered scale.
Include a title, labels for the categories, and a labelled numbered scale. Together they tell the reader what was measured, which group each column represents, and how to read its count.
Keep practising
6 worksheet questions · 11 marks
Read the questions online
- Which display is usually clearer for comparing category counts at a glance: a long unsorted response list or a column graph?1 mark
- Choose a whole-symbol key for counts 6, 9 and 12.1 mark
- A vertical axis has equally spaced labels 0, 2, 5, 8. Explain the problem.2 marks
- Draw a column graph for the supplied fruit table. Include a title, categories and a scale.3 marks
Practice survey: favourite fruit Fruit Votes Apple 8 Banana 6 Pear 4 - A pictograph uses a key of 5 for counts 2, 3 and 4. Suggest a clearer choice.2 marks
- Why should all columns in a simple column graph have equal width?2 marks
Read the worked solutions
Equivalent correct methods earn the corresponding marks. Include units where asked.
- Which display is usually clearer for comparing category counts at a glance: a long unsorted response list or a column graph?1 mark
Column heights make category sizes easier to compare.
A column graph. - Choose a whole-symbol key for counts 6, 9 and 12.1 mark
This needs 2, 3 and 4 symbols. A key of 1 also works.
One symbol represents 3 responses. - A vertical axis has equally spaced labels 0, 2, 5, 8. Explain the problem.2 marks
Use a constant step, such as 0, 2, 4, 6, 8.
The numerical increases are not equal even though the spaces are equal. - Draw a column graph for the supplied fruit table. Include a title, categories and a scale.3 marks
Practice survey: favourite fruit Fruit Votes Apple 8 Banana 6 Pear 4 A scale of 2 is convenient; other accurate regular scales are valid.
Columns should show Apple 8, Banana 6 and Pear 4, starting from zero with an even scale. - A pictograph uses a key of 5 for counts 2, 3 and 4. Suggest a clearer choice.2 marks
The key of 5 needs awkward fractions of symbols.
Use a key of 1 or a column graph. - Why should all columns in a simple column graph have equal width?2 marks
Unequal widths can make categories appear more or less important.
So their heights, rather than different widths, communicate the counts fairly.
Curriculum reference & lesson scope
Australian Curriculum v9 / SA Curriculum Mathematics 2026
Scaled pictographs/column graphs; data collection; suitable displays; distributions; survey investigations.
Official curriculum source ↗