
Understand the idea.
Read the key first
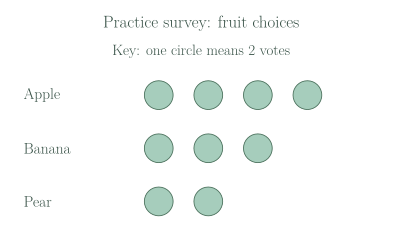
In a pictograph, the pictures stand for amounts. Read the key before counting: one circle here represents 2 votes. Count the pictures, then multiply by the number of votes represented by each picture.
For example, four circles represent four equal groups of 2 votes: . The number of pictures and the number of votes are different because the key groups the votes in twos.
Read an axis scale
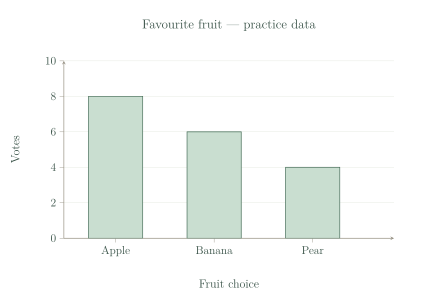
On a column graph, a column’s height shows the count. Read the title and category first, then trace from the column’s top to the numbered axis. Each equal interval on this fruit graph represents 2 votes.
The scale starts at zero, so count upwards as 0, 2, 4, 6, 8. When comparing categories, subtract their vote counts rather than counting the printed labels or judging the coloured areas.
See the method in action.
Scaled pictures
A pictograph row has 3 circles. The key says one circle means 2 votes. How many votes does the row show?
Worked solution
- 1
Read the pictograph key.
The key tells how many votes each picture represents.
- 2
Count three equal groups of two.
There are three circles, each worth two votes.
- 3
Write the represented amount.
The answer is a number of votes, rather than a number of pictures.
6 votes.
Compare columns
Using the fruit graph, how many more votes did Apple receive than Pear?
Worked solution
- 1
Read Apple’s height on the scale.
The top of the Apple column reaches the value 8.
- 2
Read Pear’s height on the same scale.
Using the same scale makes the counts directly comparable.
- 3
Find how many more Apple received.
Subtracting the smaller count from the larger finds the difference.
4 more votes.
Try it yourself.
Check your understanding
A key says one star represents 5 books. What do 4 stars represent?
Show answer & reasoning
20 books.
Each of the four stars represents 5 books, so books altogether.
Keep practising
6 worksheet questions · 8 marks
Read the questions online
- A pictograph key says one circle represents 3 votes. What do 4 circles represent?1 mark
- A key says one square represents 2 trees. How many squares show 10 trees?1 mark
- Read the number of Banana votes from the supplied graph.1 mark
- Find the total fruit votes in the supplied table.1 mark
Practice survey: favourite fruit Fruit Votes Apple 8 Banana 6 Pear 4 - A key says one symbol means 4 people. What does half a symbol mean?2 marks
- A graph scale is labelled 0, 2, 4, 6, 8. A column ends halfway between 6 and 8. What value does it show?2 marks
Read the worked solutions
Equivalent correct methods earn the corresponding marks. Include units where asked.
- A pictograph key says one circle represents 3 votes. What do 4 circles represent?1 mark
.
12 votes. - A key says one square represents 2 trees. How many squares show 10 trees?1 mark
10 divided by 2 is 5.
5 squares. - Read the number of Banana votes from the supplied graph.1 mark
Trace from the Banana column top to 6 on the vertical scale.
6 votes. - Find the total fruit votes in the supplied table.1 mark
Practice survey: favourite fruit Fruit Votes Apple 8 Banana 6 Pear 4 .
18 votes. - A key says one symbol means 4 people. What does half a symbol mean?2 marks
Half of 4 is 2.
2 people. - A graph scale is labelled 0, 2, 4, 6, 8. A column ends halfway between 6 and 8. What value does it show?2 marks
The halfway value is one above 6.
7.
Curriculum reference & lesson scope
Australian Curriculum v9 / SA Curriculum Mathematics 2026
Scaled pictographs/column graphs; data collection; suitable displays; distributions; survey investigations.
Official curriculum source ↗